
Abstract
As an innovative combination of fixed-route transit and demand responsive service, a flex-route operating policy had been introduced into feeder transit services. In this paper, a system cost function, combining vehicle operation cost and transit customer cost, is constructed as the performance measure to explore the feasibility of replacing the fixed-route policy with a flex-route policy in feeder transit systems, without disturbing the existing coordination between the major transit and feeder service. The Route F94 flex-route feeder system in Salt Lake City which connects with UTA TRAX Blue Rail Line is chosen for the analysis. The upper bound of demand for implementing the flex-route policy in this feeder service is derived. The results indicate that the Route F94 flex-route feeder system is still likely to have a distinct system advantage in operating environments with occasional request rejections, in comparison with the fixed-route service. As a result of our findings, it is possible to substantially expand the application of the flex-route policy in the feeder transit market.


Notes
Figure 2 is available at the schedule pages of the Utah Transit Authority. http://www.rideuta.com/mc/?page=Bus-BusHome-RouteF94. The shaded area with slashes represents auxiliary transit services available only in several rides, and our analysis does not consider their influence on the feasibility of the Route F94 flex-route feeder transit system.
Planners usually need to fix the maximum number of deviation stops in operation. It is hard to obtain the accurate service capacity using theoretical modeling, which overestimates the service capacity due to the variation of curb-to-curb demand (Fu 2002). Since the estimation of service capacity is not the scope of this paper, here the service capacity is defined when at least 85 % of curb-to-curb requests can be accepted in simulations. In reality, this definition has no direct influence on the discussion about Fig. 5.
References
Alshalalfah B, Shalaby A (2008) Sensitivity of flex-route transit service to design and schedule-building characteristics. Presented at 87th Annual Meeting of the Transportation Research Board, Washington, DC
Alshalalfah B, and Shalaby A (2010) Development of important relationships for the planning of flex-route transit services. Presented at 89th Annual Meeting of the Transportation Research Board, Washington, DC
Alshalalfah B, Shalaby A (2012) Feasibility of flex-route as a feeder transit service to rail stations in the suburbs: case study in Toronto. J Urban Plan D-ASCE 138(1):90–100
Daganzo CF (1984) Checkpoint Dial-a-ride Systems. Transp Res Part B 18(4–5):315–327
Fu L (1999) On-line and off-line routing and scheduling of dial-a-ride paratransit vehicles. Comput-Aided Civ Inf 14:309–319
Fu L (2002) Planning and design of flex-route transit services. Transp Res Rec 1791:59–66
Horn MET (2002a) Multi-modal and demand-responsive passenger transport systems: a modeling framework with embedded control systems. Transp Res Part A 36(2):167–188
Horn MET (2002b) Fleet scheduling and dispatching for demand-responsive passenger services. Transp Res Part C 10:35–63
Koffman D (2004) TCRP report 53: operational experiences with flexible transit services: a synthesis of transit practice. Transportation Research Board of the National Academies, Washington, DC
Li X, Quadrifoglio L (2010) Feeder transit services: choosing between fixed and demand responsive policy. Transp Res Part C 18(5):770–780
Li X, Quadrifoglio L (2011) 2-vehicle zone optimal design for feeder transit services. Public Transp 3(1):89–104
Luethi M, Weidmann U, Nash A (2007) Passenger arrival rates at public transport stations. Presented at 86rd Annual Meeting of the Transportation Research Board, Washington, DC
Nourbakhsh SM, Ouyang Y (2012) A structured flexible transit system for low demand areas. Transp Res Part B 46:204–216
Qiu F, Li W, Zhang J (2014a) A dynamic station strategy to improve the performance of flex-route transit services. Transp Res Part C 48:229–240
Qiu F, Li W, An C (2014b) A Google Maps-based flex-route transit scheduling system. 14th COTA International Conference of Transportation Professionals, Changsha, China, pp. 247–257
Qiu F, Li W, Haghani A (2014c) A methodology for choosing between fixed-route and flex-route policies for transit services. J Adv Transport. http://dx.doi.org/10.1002/atr.1289
Quadrifoglio L, Li X (2009) A methodology to derive the critical demand density for designing and operating feeder transit services. Transp Res Part B 43:922–935
Quadrifoglio L, Hall RW, Dessouky MM (2006) Performance and design of mobility allowance shuttle transit services: bounds on the maximum longitudinal velocity. Transport Sci 40(3):351–363
Tsubouchi K, Yamato H, Hiekata K (2010) Innovative on-demand bus system in Japan. IET Intell Transp Sy 4(4):270–279
Velaga NR, Nelson JD, Wright SD, Farrington JH (2012) The potential role of flexible transport services in enhancing rural public transport provision. J Public Transport 15(1):111–131
Wardman M (2004) Public transport values of time. Transp Policy 11:363–377
Weiner R (2008) TCRP report 76: integration of paratransit and fixed-route transit services. Transportation Research Board of the National Academies, Washington, DC
Zhao J, Dessouky M (2008) Service capacity design problems for mobility allowance shuttle transit systems. Transp Res Part B 42:135–146
Acknowledgments
We would like to thank the anonymous reviewers for their valuable comments on the previous drafts. The research reported in this paper is supported by the National Key Basic Research Program of China (No. 2012CB725402), the National Nature Science Foundation of China (No. 51208099), and the Program for Postgraduates Research in University of Jiangsu Province (No.CXZZ12_0111).
Author information
Authors and Affiliations
Corresponding author
Appendix A
Appendix A
-
(a)
The derivation of Eq. (12)
The distribution of type I demand in major transit customers is displayed in Fig. 6, which is uniformly distributed among checkpoints between \( c_{2} \) and \( c_{c} \).
Fig. 6 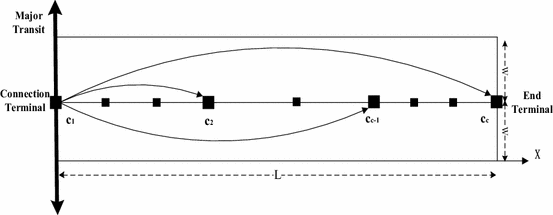
The distribution of type I demand in major transit customers in drop-off ride
For travel demand from \( c_{1} \) to \( c_{2} \), the expected riding time is \( {{T_{r} } \mathord{\left/ {\vphantom {{T_{r} } {\left( {C - 1} \right)}}} \right. \kern-0pt} {\left( {C - 1} \right)}} \);
For travel demand from \( c_{1} \) to \( c_{3} \), the expected riding time is \( {{2T_{r} } \mathord{\left/ {\vphantom {{2T_{r} } {\left( {C - 1} \right)}}} \right. \kern-0pt} {\left( {C - 1} \right)}} \);
For travel demand from \( c_{1} \) to \( c_{c} \), the expected riding time is \( {{\left( {C - 1} \right)T_{r} } \mathord{\left/ {\vphantom {{\left( {C - 1} \right)T_{r} } {\left( {C - 1} \right)}}} \right. \kern-0pt} {\left( {C - 1} \right)}} \);
Thus the expected riding time of type I passengers in major transit customers in drop-off ride can be derived as follows:
$$ R_{I - dr}^{m} = \frac{1}{{\left( {C - 1} \right)}}\frac{{T_{r} }}{{\left( {C - 1} \right)}} + \frac{1}{{\left( {C - 1} \right)}}\frac{{2T_{r} }}{{\left( {C - 1} \right)}} + \cdots + \frac{1}{{\left( {C - 1} \right)}}\frac{{\left( {C - 1} \right)T_{r} }}{{\left( {C - 1} \right)}} = \frac{{T_{r} }}{{\left( {C - 1} \right)^{2} }}\sum\limits_{i = 2}^{C} {\left( {i - 1} \right)} $$ -
(b)
The derivation of Eq. (18)
The distribution of type II demand in community riders is shown in Fig. 7, which is uniformly distributed among checkpoints between \( c_{2} \) and \( c_{c - 1} \).
Fig. 7 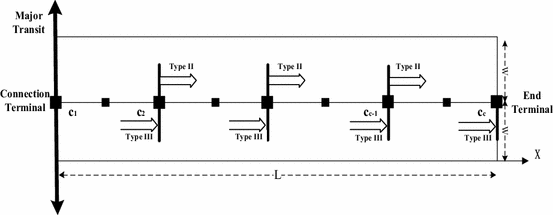
The distribution of type II and III demand in community riders in drop-off ride
For travel demand whose starting point is \( c_{2} \), the probability of having no waiting time is
$$ \frac{{\left[ {{L \mathord{\left/ {\vphantom {L {2\left( {S - 1} \right)}}} \right. \kern-0pt} {2\left( {S - 1} \right)}}} \right]}}{{\left[ {{L \mathord{\left/ {\vphantom {L {\left( {C - 1} \right)}}} \right. \kern-0pt} {\left( {C - 1} \right)}}} \right]\left( {C - 2} \right)}} $$For travel demand whose starting point is \( c_{3} \), the probability of having no waiting time is
$$ \frac{{\left[ {{L \mathord{\left/ {\vphantom {L {2\left( {S - 1} \right)}}} \right. \kern-0pt} {2\left( {S - 1} \right)}}} \right]}}{{\left[ {{L \mathord{\left/ {\vphantom {L {\left( {C - 1} \right)}}} \right. \kern-0pt} {\left( {C - 1} \right)}}} \right]\left( {C - 3} \right)}} $$For all type II demand in community riders in drop-off ride, the probability of having no waiting time is
$$ \frac{1}{C - 2}\frac{{\left[ {{L \mathord{\left/ {\vphantom {L {2\left( {S - 1} \right)}}} \right. \kern-0pt} {2\left( {S - 1} \right)}}} \right]}}{{\left[ {{L \mathord{\left/ {\vphantom {L {\left( {C - 1} \right)}}} \right. \kern-0pt} {\left( {C - 1} \right)}}} \right]\left( {C - 2} \right)}} + \frac{1}{C - 2}\frac{{\left[ {{L \mathord{\left/ {\vphantom {L {2\left( {S - 1} \right)}}} \right. \kern-0pt} {2\left( {S - 1} \right)}}} \right]}}{{\left[ {{L \mathord{\left/ {\vphantom {L {\left( {C - 1} \right)}}} \right. \kern-0pt} {\left( {C - 1} \right)}}} \right]\left( {C - 3} \right)}} + \cdots + \frac{1}{C - 2}\frac{{\left[ {{L \mathord{\left/ {\vphantom {L {2\left( {S - 1} \right)}}} \right. \kern-0pt} {2\left( {S - 1} \right)}}} \right]}}{{\left[ {{L \mathord{\left/ {\vphantom {L {\left( {C - 1} \right)}}} \right. \kern-0pt} {\left( {C - 1} \right)}}} \right]\left( {C - C + 1} \right)}} $$Thus, the expected waiting time of type II demand in community riders in drop-off ride can be expressed as follows:
$$ A_{II - dr}^{c} = \varphi T_{c} \left[ {\frac{1}{2} - \frac{C - 1}{{4\left( {C - 2} \right)\left( {S - 1} \right)}}\sum\limits_{i = 2}^{C - 1} {\frac{1}{{\left( {C - i} \right)}}} } \right] $$ -
(c)
The derivation of Eq. (19)
Similar to the derivation of Eq. (18), for type III demand in community riders in drop-off ride (see Fig. A2), the probability of having no waiting time is
$$ \frac{1}{C - 1}\frac{{\left[ {{L \mathord{\left/ {\vphantom {L {2\left( {S - 1} \right)}}} \right. \kern-0pt} {2\left( {S - 1} \right)}}} \right]}}{{\left[ {{L \mathord{\left/ {\vphantom {L {\left( {C - 1} \right)}}} \right. \kern-0pt} {\left( {C - 1} \right)}}} \right]\left( {C - 1} \right)}} + \frac{1}{C - 1}\frac{{\left[ {{L \mathord{\left/ {\vphantom {L {2\left( {S - 1} \right)}}} \right. \kern-0pt} {2\left( {S - 1} \right)}}} \right]}}{{\left[ {{L \mathord{\left/ {\vphantom {L {\left( {C - 1} \right)}}} \right. \kern-0pt} {\left( {C - 1} \right)}}} \right]\left( {C - 2} \right)}} + \cdots + \frac{1}{C - 1}\frac{{\left[ {{L \mathord{\left/ {\vphantom {L {2\left( {S - 1} \right)}}} \right. \kern-0pt} {2\left( {S - 1} \right)}}} \right]}}{{\left[ {{L \mathord{\left/ {\vphantom {L {\left( {C - 1} \right)}}} \right. \kern-0pt} {\left( {C - 1} \right)}}} \right]\left( {C - C + 1} \right)}} $$Thus, the expected waiting time of type III demand in community riders in drop-off ride can be obtained:
$$ A_{III - dr}^{c} = \varphi T_{c} \left[ {\frac{1}{2} - \frac{1}{{4\left( {S - 1} \right)}}\sum\limits_{i = 1}^{C - 1} {\frac{1}{{\left( {C - i} \right)}}} } \right] $$


Rights and permissions
About this article

Cite this article
Qiu, F., Li, W. & Haghani, A. An exploration of the demand limit for flex-route as feeder transit services: a case study in Salt Lake City. Public Transp 7, 259–276 (2015). https://doi.org/10.1007/s12469-014-0097-9
Published:
Issue Date:
DOI: https://doi.org/10.1007/s12469-014-0097-9