Kubecost allows us to track and reduce Kubernetes costs.
Kubecost helps you monitor and manage cost and capacity in Kubernetes environments. Installation To get started with Kubecost, the recommended path is to install Kubecost community version. This metho
Kubecost helps you monitor and manage cost and capacity in Kubernetes environments.
![]()
Installation
To get started with Kubecost, the recommended path is to install Kubecost community version.
This method of installation is free and uses the Kubecost helm chart. It can scale to large clusters and provides access to all OpenCost and Community Kubecost functionalities.
In order to deploy the Kubecost helm chart, ensure the Helm client (version 3.0+) installed (Install Here)
- Step 1: Install Kubecost
Running the following commands will also install Prometheus, Grafana, and kube-state-metrics in the namespace supplied. View install configuration options here.
helm 3
kubectl create namespace kubecost
helm repo add kubecost https://kubecost.github.io/cost-analyzer/
helm install kubecost kubecost/cost-analyzer --namespace kubecost --set kubecostToken="YmFya2F0dWwuMjBAZ21haWwuY29txm343yadf98"
- Step 2: Enable port-forward
kubectl port-forward --namespace kubecost deployment/kubecost-cost-analyzer 9090
- Step 3: See the data!
You can now view the deployed frontend by visiting the following link. Publish :9090 as a secure endpoint on your cluster to remove the need to port forward.
http://localhost:9090
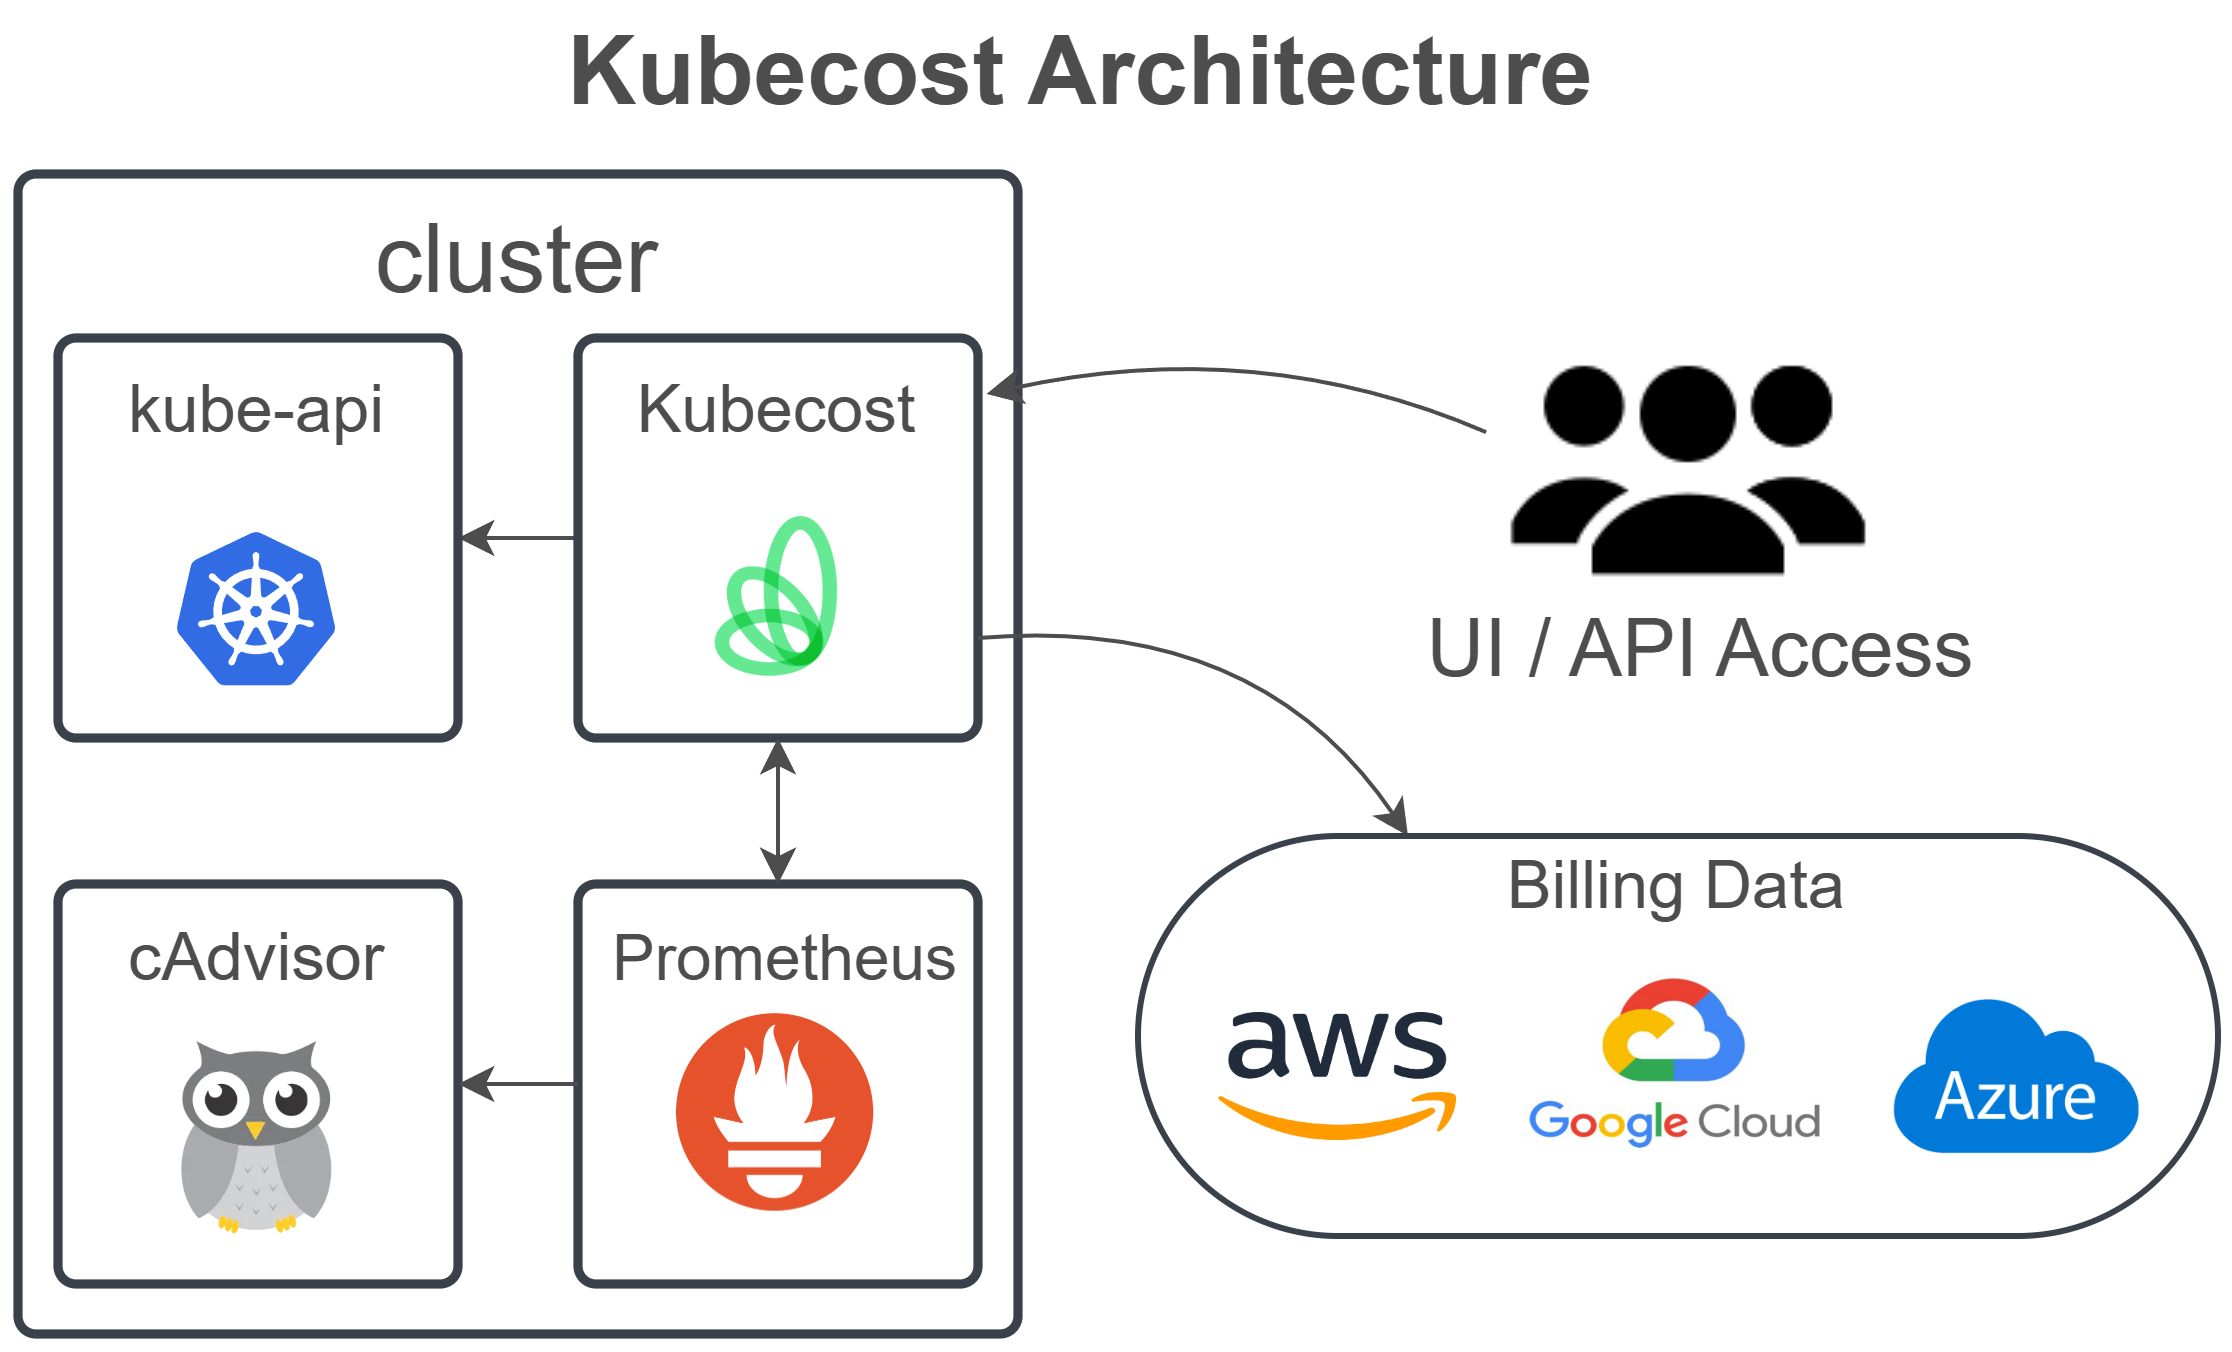
Kubecost Architecture Overview:
Core Architecture
The key components used with the Kubecost helm chart are listed below, except critical Enterprise components such as durable storage:
Kubecost Cost-Analyzer Pod
- a. Frontend – runs Nginx and handles routing to Kubecost backend + Prometheus/Grafana.
- b. Kubecost server – backend for API calls.
- c. Cost-model – Reads and writes to Prometheus, providing cost allocation computations and metrics.
Prometheus
- a. Prometheus server – cost and health metrics time-series data store.
- b. Kube-state-metrics – delivers metrics from the Kubernetes API, such as resource requests.
- c. Node-exporter – provides node-level utilization metrics for right-sizing recommendations and cluster utilization [Optional].
- d. Pushgateway – provides the ability for users to push new metrics to Prometheus [Optional].
- e. Alertmanager – used for custom alerts [Optional].
Network costs – optional DaemonSet for collecting network metrics. Learn more
- Grafana – provides supporting dashboards for Kubecost product [Optional].
Only components 1, 3a, and 3b are required to run the core Kubecost product today.
In this figure, you can see an overview of the main components:
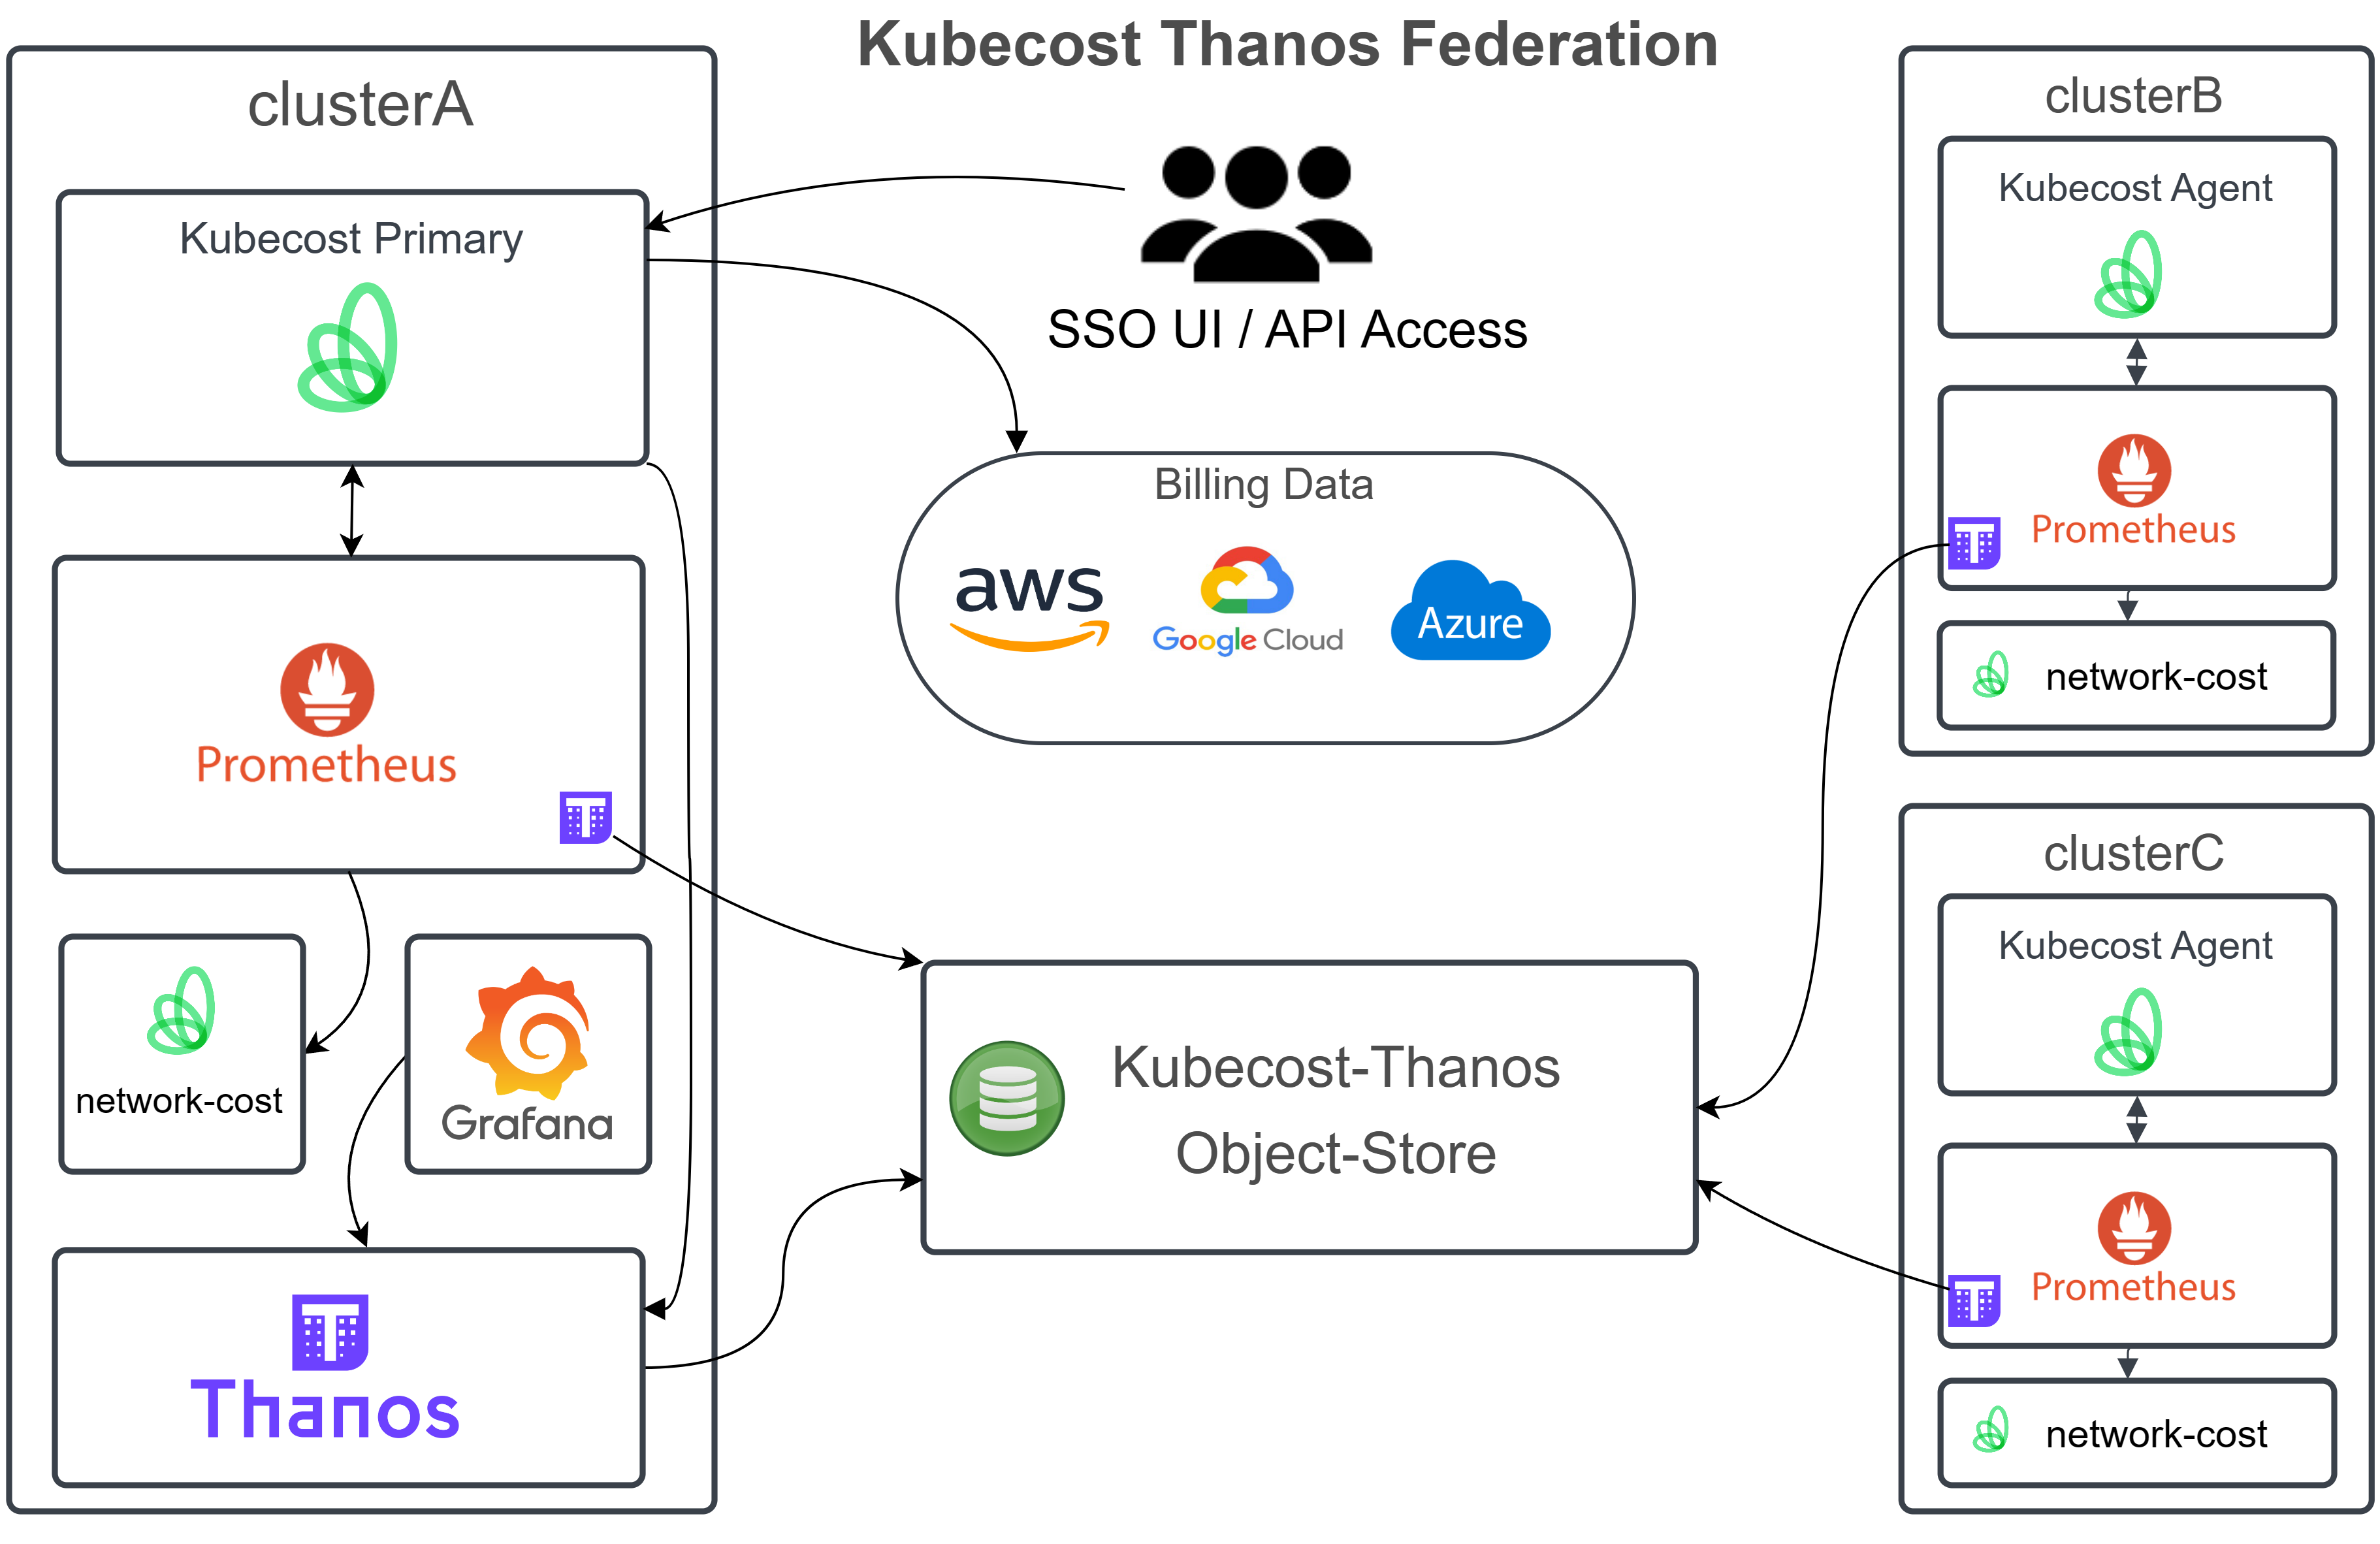
Enterprise architecture overview
Thanos is the most typical way to deploy durable storage in the Kubecost application. The required components are listed below at a high level. Here's where you may learn more about each Thanos component.
Features
Cost Allocation
Kubecost allows us to see allocated spending across all native Kubernetes concepts, allowing us to deliver clear, precise cost data to our teams that are reconciled with our actual cloud account.
Costs can be broken down using any Kubernetes term, such as deployment, service, namespace label, and so on. Costs from many clusters can be viewed in one place or accessed through a single API call.
Unified Cost Monitoring
By combining real-time expenses from our Kubernetes cluster (CPU, memory, storage, network, etc.) with external expenditures, such as tagged RDS instances, BigQuery warehouses, or S3 buckets, we can see unified spending.
To get a complete view, we can add Kubernetes charges to any external cloud services or infrastructure spending. For a comprehensive perspective of spend, external costs can be shared and then assigned to any Kubernetes concept.
Optimization Insights
Kubecost delivers insights that we can use to save 30-50 percent or more on our infrastructure spend without compromising our private information—even with kubecost, our data is never shared outside.
We get dynamic tips on how to save money without sacrificing performance. Improve resource efficiency and dependability by prioritizing essential infrastructure or application upgrades.
Alerts & Governance
Kubecost helps organizations to take control of their Kubernetes-enabled infrastructure, stay under-budgeted limitations, and respond to monitoring disturbances quickly with real-time alerting capability and periodic reports.
With real-time warnings, we can quickly detect cost overruns and infrastructure outage concerns before they become an issue. Integrate with technologies like PagerDuty and Slack to keep engineering workflows intact.
What’s more
Kubecost can send Slack and email notifications. You can set a cost threshold for namespaces and receive notifications when any namespace exceeds the budget.
If you use spot instances, you can integrate spot feeds to get accurate pricing information.
Kubecost is compatible with AWS and GCP. It also lets you provide custom pricing if you don't want to integrate with billing accounts.
Conclusion
Kubecost covered almost all our requirements. Kubecost support is also very prompt and the team is always up for help. If you are looking for any open source tool to get your Kubernetes cluster cost insights coupled with your cloud provider’s costing details, then Kubecost is worth trying.
Reference
Kunal Kushwaha
Thank you for a reading mate, If you find this blog useful, please like, comment, and share it.
Connect with me on :

K8S/Kubernetes社区为您提供最前沿的新闻资讯和知识内容
更多推荐
 0
0 0
0- 0


 已为社区贡献20439条内容

所有评论(0)