


python风控评分卡建模和风控常识
Toby,项目合作QQ:231469242
Credit Scorecards – Introduction (part 1 of 7)
http://ucanalytics.com/blogs/credit-scorecards-part-1/
Credit Scorecards in the Age of Credit Crisis
This incident took place at a friend’s party circa 2009, in the backdrop of the worst financial crisis the planet has seen for a long time. The average Joe on the street was aware of terms such as mortgaged-backed securities (MBS), sub-prime lending and credit crisis – the reasons for his plight. Back to our party, I met an informed & compassionate elderly woman and after a few minutes of chitchat, the topic came to what I do for a living. At that point, I was working on a project of developing credit-scorecard for a leading mortgage lender in Mumbai. As I started explaining the details of my job, her expression changed from curious to angst and pain. Eventually, she interrupted and said – why would you do such a thing? Is this not the reason for all the mess? I was used to this reaction and had to correct her misconception.
信用危机时代的信用记分卡
这一事件发生在大约2009年的朋友聚会上,在这个星球长期以来最严重的金融危机背景下。 街上的乔普通知道抵押贷款支持证券(MBS),次级贷款和信贷危机等条款 - 这是他困境的原因。 回到我们的聚会上,我遇到了一位知情和富有同情心的老年妇女,经过几分钟的闲聊,这个主题来到了我的生活。 那时,我正在为孟买一家领先的抵押贷款机构开发一个信用记分卡项目。 当我开始解释我的工作细节时,她的表情从好奇变为焦虑和痛苦。 最后,她打断了她说 - 你为什么要做这样的事? 这不是所有混乱的原因吗? 我习惯了这种反应,不得不纠正她的误解。

Predictive Analytics: The lurking Danger – by Roopam
Credit or application scorecards can be excellent tools for both lender and borrower to work out debt serving capability of the borrower. For lenders, scorecards can help them assess the creditworthiness of the borrower and maintain a healthy portfolio – which will eventually influence the economy as a whole. Additionally to the borrower, they can provide valuable information such as 45% of people with her socio-economic background have struggled to keep up with the EMI commitment. This could help the borrower make a well-informed decision before getting into a debt trap. Blaming science for reckless human behavior is not new. I believe, any rigorous science with practical applications is like a sharp German blade, a master chef prepares delicious meals with it and the irresponsible leaves a deep and painful cut.
信用卡或应用程序记分卡可以成为贷款人和借款人计算借款人偿债能力的绝佳工具。 对于贷方而言,记分卡可以帮助他们评估借款人的信誉并维持健康的投资组合 - 这最终将影响整个经济。 除借款人外,他们还可以提供有价值的信息,例如45%具有社会经济背景的人都在努力跟上EMI的承诺。 这可以帮助借款人在陷入债务陷阱之前做出明智的决定。 为鲁莽的人类行为指责科学并不新鲜。 我相信,任何具有实际应用的严谨科学就像一把锋利的德国刀片,一位大厨用它准备可口的饭菜,而不负责任的会留下深刻而痛苦的切口。
Scorecards and Predictive Analytics
In the following series, we will explore the practitioners’ approach for developing and maintaining a scorecard. At a very high-level, credit scorecards have their roots in the classification problem in statistics & data mining. The classification problems present an extremely broad methodology/thought-process that has multiple business applications. A few applications for classification problem are:
• Behavioral models to identify the most probable future action of the customer
• Fraud detection models
• Cross/up sell propensity models
• Campaign response models
• Insurance ratings
在下面的系列中,我们将探讨从业者开发和维护记分卡的方法。 在非常高的层次上,信用记分卡的根源在于统计和数据挖掘中的分类问题。 分类问题提供了一个极其广泛的方法/思维过程,具有多个业务应用程序。 一些分类问题的应用是:
•应用程序或信用记分卡,用于评估借款人的还款风险
•MRI的图像分析,以确定癌症是仁慈的还是恶性的
•行为模型,用于识别客户最可能的未来行为
•鉴定蛋白质结构中的潜在药物靶标
•欺诈检测模型
•推文和Facebook帖子的情绪分析
•交叉/向上销售倾向模型
•活动响应模型
•保险评级
For that matter, there are subtle links between credit scorecards and other models mentioned above. The details of these models could be drastically different but the underlining idea for these models is linked to the classification problem. In this series, I shall focus on credit or application scorecard methodology but will try to bring in other another scorecards and models whenever possible.
就此而言,信用记分卡与上述其他模型之间存在微妙的联系。 这些模型的细节可能截然不同,但这些模型的强调理念与分类问题有关。 在本系列中,我将重点介绍信用卡或应用记分卡方法,但会尝试尽可能引入其他记分卡和模型。
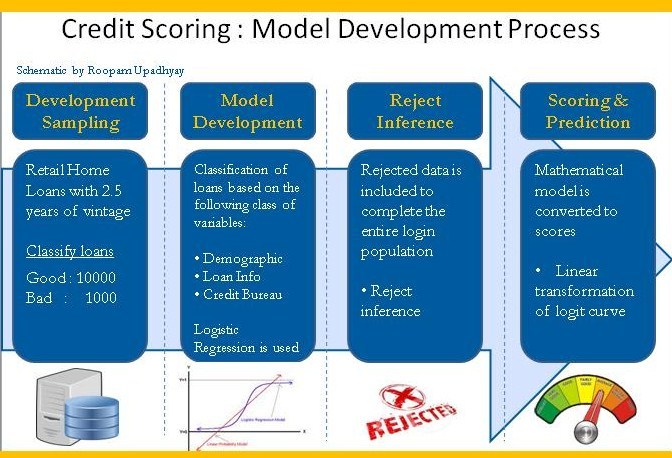
Credit Scoring: Development Stages of Credit Scorecard – by Roopam
Flow of Subsequent Articles
The flow of subsequent articles in the series will be as following
1. Classification problem and sampling
2. Variable selection and coarse classing
3. Predictive Models
4. Logistic regression and scorecards
5. Model validation
6. Application and business process integration
后续文章的流程
该系列中后续文章的流程如下
1.分类问题和抽样
2.变量选择和粗略分类
3.预测模型
4.逻辑回归和记分卡
5.模型验证
6.应用程序和业务流程集成
Books for Credit Scorecards
I have compiled a list of books you may find useful while learning about analytical scorecards. The first four of these books have more or less the same flow, with Anderson’s book (#4) a little more detailed. However, you could choose any one of these four books without losing much .The last book (#5) is a collection of articles / papers by practitioners and academicians and is quite interesting.
信用记分卡的书籍
在编写分析记分卡时,我编制了一份您可能会发现有用的书籍清单。 这些书中的前四本或多或少都有相同的流程,而安德森的书(#4)更为详细。 但是,您可以选择这四本书中的任何一本,而不会损失太多。最后一本书(#5)是一组由从业者和学者组成的文章/论文,非常有趣。
1. Credit Risk Scorecards: Developing and Implementing Intelligent Credit Scoring – Naeem Siddiqi
2. Credit Scoring, Response Modeling, and Insurance Rating: A Practical Guide to Forecasting Consumer Behavior – Steven Finlay
3. Credit Scoring for Risk Managers: The Handbook for Lenders – Elizabeth Mays and Niall Lynas
4. The Credit Scoring Toolkit: Theory and Practice for Retail Credit Risk Management and Decision Automation – Raymond Anderson
5. Credit Risk Models – Elizabeth Mays
Sign-off Note
Look forward to sharing my views on predictive analytics and hearing back from you. See you soon with the second part of this series.
Credit Scorecards – Classification Problem (part 2 of 7)
http://ucanalytics.com/blogs/credit-scorecards-classification-problem-part-2/
Classification Problem in Statistics & Data Mining
I must say I was shocked when Amishi, a girl little over three years old, announced that going forward she is only friends with my wife and not me. Her reason for the breakup was that I am a boy and girls can only be friends with girls. She has learned this social norm from her friends at the preschool. I still remember the way she modeled for me in her swimsuit and umbrella just a few months ago. She was aware of the boy-girl difference even then, it is just she has learned this weird social norm now. The point over here is that toddlers can distinguish genders without much effort. Nature has given us a built-in equation to classify gender through a mere glance with a high degree of precision. Imagine a similar mechanism to distinguish between good and bad borrowers. You are talking about every banker’s dream. However, evolution has trained us to mate not to lend.
我必须说,当三十岁的女孩Amishi宣布前进时,她只是与我的妻子而不是我的朋友,我感到震惊。 分手的原因是我是男孩,女孩只能是女孩的朋友。 她从幼儿园的朋友那里学到了这种社会规范。 几个月前,我还记得她在泳衣和雨伞中为我塑造的方式。 即便如此,她也意识到了男女之间的差异,现在只是她已经学会了这种奇怪的社会规范。 这里的重点是,幼儿可以毫不费力地区分性别。 大自然给了我们一个内置的方程式,通过高度精确的一瞥来对性别进行分类。 想象一下类似的机制来区分好的和坏的借款人。 你在谈论每个银行家的梦想。 然而,进化训练我们交配不放贷。

Predictive Analytics: Classification Problem – by Roopam
As I have mentioned in the previous article, scorecards have their roots in the classification problem in statistics and data mining. The idea with most classification problems is to create a mathematical equation to distinguish dichotomous variables. These variables can only take two values such as
• Male/ Female
• Good / Bad
• Yes / No
• God / Devil
• Happy / Sad
• Sales / No Sales
The list can go on until eternity. The reason why most business problems try to model dichotomies is that it is easy to comprehend for us humans. We must appreciate that dichotomies are never absolute and have degrees attached to them. For example, I am 80% good and 20% bad – at least I would like to believe this. I shall keep Pareto’s 80-20 principle away from this i.e. my 20% bad is responsible for my 80% of behavior.
正如我在上一篇文章中提到的,记分卡的根源在于统计和数据挖掘中的分类问题。 大多数分类问题的想法是创建一个数学方程来区分二分变量。 这些变量只能采用两个值,例如
•男/女
• 好坏
•是/否
•上帝/魔鬼
•快乐/悲伤
•销售/无销售
这份清单可以持续到永恒。 大多数商业问题试图模拟二分法的原因是它很容易理解我们人类。 我们必须明白,二分法从来都不是绝对的,是有度的。 例如,我80%好,20%坏 - 至少我想相信这一点。 我将保持帕累托的80-20原则远离这一点,即我的20%不好对我80%的行为负责。
Credit Scorecards Development – Problem Statement & Sampling(坏客户定义是灵活的)
In the case of credit scorecards, the problem statement is to distinguish analytically between the good and bad borrowers. Hence, the first task is to define a good and a bad borrower. For most loan products, good and bad credit is defined in the following way
1. Good loan: never or once missed on the EMI payment
2. Bad loan: ever missed 3 consecutive EMIs in a row (i.e. 90 days-past-due)
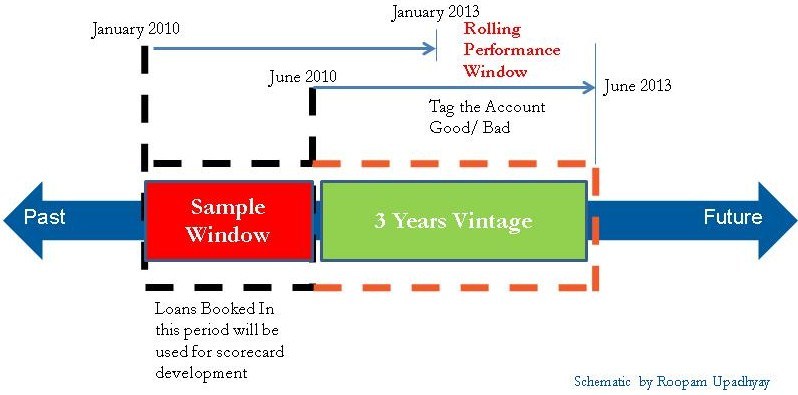
Additionally, for tagging someone good or bad, you need to observe his or her behavior for a significant length of time. This length of time varies from product to product based on the tenor of the loan. For home loans, with a tenor of 20 years, 2-3 years is a reasonable observation period.
However, there is nothing sacrosanct about the above definition and can be modified at the discretion of the analyst. Roll-rate analysis and vintage analysis are the two analytical tools you may want to consider while constructing the above definition.
信用记分卡开发 - 问题陈述和抽样
在信用记分卡的情况下,问题陈述是在好的和坏的借款人之间进行分析。因此,第一个任务是定义一个好的和坏的借款人。对于大多数贷款产品,信用良好和不良以下列方式定义
1.良好的贷款:永远或曾一次逾期
2.不良贷款:连续3次错过EMI(即90天过期)
此外,为了标记好人或坏人,你需要在很长一段时间内观察他或她的行为。根据贷款期限,这段时间因产品而异。对于房屋贷款,期限为20年,2 - 3年是合理的观察期。
但是,对于上述定义没有什么神圣不可侵犯的,可以由分析师自行决定修改。滚动率分析和复古分析是您在构建上述定义时可能需要考虑的两种分析工具。
Sampling Strategy for Credit Scorecards
A few years ago, I did a daylong workshop on Statistical Inference for a large German shipping & cargo company in Mumbai. At the time of Q&A session the Vice President of operations asked a tricky question, what is a good sample size to achieve good precision? He was looking for a one-size-fits-all answer and I wish it were that simple. The sample size depends on the degree of similarity or homogeneity of the population in question. For example, what do you think is a good sample size to answer the following two questions?
1. What is the salinity of the Pacific Ocean?
2. Is there another planet with intelligent life in the Universe?
In terms of population size, a number of drops in the ocean and planets in the Universe is similar. A couple of drops of water are enough to answer the first question since the salinity of oceans is fairly constant. On the other hand, the second question is a black swan problem. You may need to visit every single planet to rule our possibility of an intelligent form of life.
For credit scorecard development, the accepted rule of thumb for sample size is at least 1000 records of both good and bad loans. There is no reason why you cannot build a scorecard with a smaller sample size (say 500 records). However, the analyst needs to be cautious in doing so because a higher degree of randomness creeps in a small data sample. Additionally, it is also advisable to keep the sample window as short as possible i.e. a financial quarter or two while scorecard development. Further, the sample is divided into two pieces – usually, 70 % for development and remaining for validation sample. We discuss the development and validation sample in detail in the subsequent sections of this series.
信用记分卡的抽样策略
几年前,我为孟买的一家大型德国航运和货运公司举办了为期一天的统计推断研讨会。在问答环节时,运营副总裁提出了一个棘手的问题,即获得良好精度的样本量是多少?他正在寻找一个通用的答案,我希望它很简单。样本量取决于所讨论的群体的相似程度或同质性。例如,您认为回答以下两个问题的样本量是多少?
1.太平洋的盐度是多少?
2.宇宙中还有另一个拥有智慧生命的星球吗?
就人口规模而言,宇宙中海洋和行星的数量下降是相似的。由于海洋的盐度相当稳定,几滴水足以回答第一个问题。另一方面,第二个问题是黑天鹅问题。您可能需要访问每个星球来统治我们生活的智能生活的可能性。
对于信用记分卡开发,样本大小的公认经验法则是至少1000个好的和坏的贷款记录。没有理由不能建立样本量较小的记分卡(比如500条记录)。但是,分析师需要谨慎行事,因为较小程度的随机性会在小数据样本中蔓延。此外,还建议尽可能缩短样本窗口,即在记分卡开发时用一个或两个季度数据。此外,样品分为两部分 - 通常70%用于显影,剩余用于验证样品。我们将在本系列的后续章节中详细讨论开发和验证示例。
Credit Scorecard Development: Sampling Strategy – by Roopam
Sign-off Note
In the next article, we will discuss an important topic of variables classing and coarse classing for credit scorecards. See you soon
Credit Scorecards – Variables Selection (part 3 of 7)
http://ucanalytics.com/blogs/credit-scorecards-variables-selection-part-3/
Variables Selection in Predictive Analytics

Predictive Analytics: Variables Selection – by Roopam
The following story goes back to the time when I just started my transition from physics to business. I met this investment banker* in his mid-thirties during a Friday night party. After gulping down a few pints of beer, his mood became a bit somber and he told me how he hates his job. However, he had a plan of working his ass off until he retires at 45. Then he will do everything that makes him happy. I was thoroughly confused, how could someone debar himself from an emotion – happiness – for so many years and rediscover it later? I was wondering about the recipe for happiness – raindrops on roses and whiskers on kittens. An individual’s happiness is a tricky thing; however, I shall attempt to tackle this issue in my later article on logistic regression. For now, let us try to explore how states measure the collective well-being of their people. I shall use this topic of population well-being to explore an interesting topic in analytical scorecard development: variables selection.
以下故事可以追溯到我刚开始从物理到商业的过渡时期。 我在周五晚上的聚会期间遇到了这位投资银行家*。 在喝了几品脱啤酒之后,他的心情变得有些忧郁,他告诉我他是如何讨厌自己的工作的。 然而,他有一个计划工作他的屁股,直到他在45退休。然后他会做一切让他开心的事情。 我彻底搞糊涂了,这么多年以后,有多少人会从情感 - 快乐中贬低自己,并在以后重新发现它? 我想知道快乐的秘诀 - 玫瑰上的雨滴和小猫的胡须。 个人的幸福是一件棘手的事情; 但是,我将在后面关于逻辑回归的文章中尝试解决这个问题。 现在,让我们试着探讨各国如何衡量其人民的集体福祉。 我将利用这个人口福祉主题来探索分析记分卡开发中的一个有趣话题:
Variables Selection – Lessons from GDP & GNH
The most popular measure for national prosperity, unanimously projected by economists and TV channels, is Gross Domestic Product (GDP). The equation for measuring GDP as taught in macroeconomics 101 is:
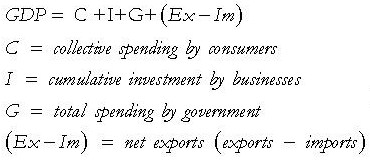
Clearly, there are 5 factors/variables that govern GDP according to this equation. The first look at GDP as a measure for national well-being seemed incomplete to me. All the variables for GDP were from commerce. They are important but cannot be the only factors for country’s well-being, more so in a highly diverse & complicated country like India.
ariables Selection - 来自GDP和GNH的经验教训
经济学家和电视频道一致预测的最受国民兴趣的衡量标准是国内生产总值(GDP)。 宏观经济学101中教授的衡量GDP的等式是:
GDP方程式
显然,根据这个等式,有5个因素/变量可以控制GDP。 首先将国内生产总值视为衡量国家福祉的指标对我来说似乎不完整。 GDP的所有变量都来自商业。 它们很重要,但不能成为国家福祉的唯一因素,在印度等高度多样化和复杂的国家更是如此。
Gross National Happiness Index – The Story of Bhutan Naresh

Variables Selection – by Roopam
Ok, so what else do we have? A lesser-known index is Gross National Happiness (GNH). The origins of GNH are in Bhutan. They measure their country’s progress through GNH. The term was coined and implemented by Jigme Singye Wangchuck. This name immediately takes me back to the early nineties live telecast of the SAARC summit by India’s national broadcaster Doordarshan (DD). The old-timer Hindi commentators were referring to a modest man in a bathrobe-like-attire as ‘Bhutan Naresh’ – King of Bhutan. At first glance, he did not fit well with the power horses of the south Asian region. Nevertheless, he seems to have devised a more holistic metric to measure his country’s well-being. GNH is a combination of the following broad categories:
1. Living standard & income
2. Health coverage
3. Physiological well-being
4. Time spent at work and relaxing
5. Good governance
6. Schooling & education
7. Cultural diversity
8. Community vitality
9. Environmentalism and conservatism
There are 72 total variables in GNH measured on a scale of 0 to 1, such as daily hours of sleep and trust in media; hmmm, not a bad start! You could do your own research on GNH and let me know what you feel about it. Actually, we can work out our own formula for a GNH like metric. The idea is to select the right variables to build your model!
国民幸福总指数 - 不丹纳雷什的故事
变量选择 - 由Roopam
好的,那我们还有什么呢?一个鲜为人知的指数是国民幸福总值(GNH)。 GNH的起源在不丹。他们通过GNH衡量他们国家的进步。该术语由Jigme Singye Wangchuck创造和实施。这个名字让我回到了印度国家广播公司Doordarshan(DD)在九十年代早期的SAARC峰会现场直播。旧时的印地语评论员指的是一个穿着浴衣般装扮的谦虚男人,就像不丹之王“不丹纳雷什”。乍一看,他并不适合南亚地区的动力马。然而,他似乎已经设计了一个更全面的衡量标准来衡量他的国家的福祉。 GNH是以下大类的组合:
1.生活水平和收入
2.健康保险
3.生理健康
4.工作和放松的时间
5.善治
6.学校教育
7.文化多样性
8.社区活力
9.环境保护主义和保守主义
GNH中有72个总变量,按0到1的等级测量,例如每天的睡眠时间和对媒体的信任;嗯,这不是一个糟糕的开始!你可以自己研究GNH,让我知道你对它的看法。实际上,我们可以为GNH度量标准制定出我们自己的公式。我们的想法是选择正确的变量来构建您的模型!
Variables Selection in Credit Scoring
In data mining and statistical model building exercises, similar to credit scoring, variables selection process is performed through statistical significance – a reasonably automated process through advanced software. However, the variables are still created and measured by humans. High impact analyses in businesses are still driven by hunches. Human intelligence is not obsolete yet.
In one of the projects I did with a financial organization, the result of credit risk analysis and scoring led to redesigning of the application form. Application forms are a major source of data collection regarding the borrower. However, nobody wants to fill a lengthy form hence an optimal size of the form ensures accurate information provided by the borrower. The idea is to select the right variable and ensure accurate measurement.
There are several aspects regarding variables but I will mention just one of them here (coarse classing).
信用评分中的变量选择
在数据挖掘和统计模型构建练习中,类似于信用评分,变量选择过程通过统计显着性来执行 - 通过高级软件进行合理自动化的过程。 但是,变量仍由人类创造和测量。 企业的高影响力分析仍然受到预感的驱动。 人类智慧尚未过时。
在我与金融机构合作的一个项目中,信用风险分析和评分的结果导致了申请表的重新设计。 申请表是有关借款人的主要数据收集来源。 然而,没有人想要填写冗长的表格,因此表格的最佳尺寸确保了借款人提供的准确信息。 我们的想法是选择正确的变量并确保准确的测量。
关于变量有几个方面,但我在这里只提到其中一个(粗略分类)。
Coarse Classing in Credit Scoring
 One of my favorite activities as a kid was going to a shoe store and getting my feet measured every summer before the school started. The shoe shops had a strange, miniature, slide-like device to measure foot size. It was fun to see my feet grow from one size to another every year or two. The growth was quantized i.e you are size-2 or 3 never 2.5 or 2.7. This aspect of converting measure such as 2.5 & 2.7 to 3 is called grouping, bucketing or classing. This is an integral part of creating scorecards that you will find in all the books I have listed in the first part of this blog series.
I have been a part of several heated discussions on the relevance of coarse class in scorecard development throughout my career. In most, if not all academic articles you will rarely see coarse classing as a technique during model development. Quite a few academicians & practitioners for a good reason believe that coarse classing results in loss of information. However, in my opinion, coarse classing has the following advantage over using raw measurement for a variable.
1. It reduces random noise that exists in raw variables – similar to averaging and yes, you lose some information here.
2. It handles extreme events – on two extremes of a variable – much better where you have thin data.
3. It handles the non-linear relationship between dependent and independent variable without a lot of effort of variable transformation from the analyst.
信用评分中的粗分类
3鞋子测量我小时候最喜欢的一项活动是去一家鞋店,每年夏天在学校开始前测量我的脚。这些鞋店有一个奇怪的,微型的滑动式设备来测量脚的大小。每年或每两年看到我的脚从一个尺寸增长到另一个尺寸很有趣。增量被量化,即你的大小为2或3从不2.5或2.7。将诸如2.5和2.7之类的度量转换为3的这一方面称为分组,分组或分类。这是创建记分卡的一个组成部分,您可以在本博客系列的第一部分列出的所有书籍中找到这些记分卡。
在我的职业生涯中,我参与了几个关于粗俗课程在记分卡开发中的相关性的热烈讨论。在大多数情况下,如果不是所有的学术文章,你很少会在模型开发过程中看到粗略的分类。相当多的学者和从业者有充分理由相信粗略的分类会导致信息丢失。但是,在我看来,粗略分类比使用变量的原始测量具有以下优势。
1.它减少了原始变量中存在的随机噪声 - 类似于平均值,是的,你在这里丢失了一些信息。
它处理极端事件 - 在变量的两个极端情况下 - 在您拥有精简数据的情况下更好。
3.它处理依赖变量和自变量之间的非线性关系,而无需分析师进行变量转换。
Sign-off Note
We are half way through this series on ‘Analytical Scorecard Development’ and I am enjoying writing this thoroughly. I hope as a reader you are on the same page. Scorecard building is highly technical and I have tried to discuss some aspects with easy to understand examples. However, to manage the length of the article, I am not able to get into the details. I must say that I love the details! So, if you have any queries, doubts, points-of-view or recommendations please write back on the discussion board or on my email: roopam.up@gmail.com
Credit Scorecards – Advanced Analytics (part 4 of 7)
http://ucanalytics.com/blogs/credit-scorecards-advanced-analytics-part-4/
Modeling in Advanced Analytics

Advanced Analytics: Model Development – by Roopam
The room, full of Analysts, erupts with a loud round of laughter when a young business analyst narrates to us an incident from his recent trip back home. A distant aunt inquired about his new profession. His response – I am into modeling. She got all excited and asked – is it just on the ramp or will I see you on the television? Jokes apart, this left me wondering about the roots of the word modeling or model. What is a model?
A model is defined as a simplified representation of reality. A representation of reality, hmmm, a photograph is a representation of reality – a moment of reality capture on the reel – does that makes it into a model. I think yes. Similarly, a newspaper reporter covering an incident and makes it into breaking news is also a model – a descriptive model. Now, let us try to link models with Analytics.
当一位年轻的商业分析师向我们讲述他最近回家的事件时,充满分析师的房间爆发出一阵响亮的笑声。 一位遥远的阿姨询问了他的新职业。 他的回答 - 我正在进行建模。 她兴高采烈地问道 - 它只是在坡道上还是我会在电视上看到你? 开玩笑,这让我想知道建模或模型这个词的根源。 什么是模特?
模型被定义为现实的简化表示。 现实的表现,嗯,照片是现实的代表 - 在卷轴上捕捉现实的瞬间 - 这使它成为一个模型。 我想是的。 同样,报道一个事件并将其作为突发新闻的报纸记者也是一个模型 - 描述性模型。 现在,让我们尝试将模型与Google Analytics相关联。
Data warehouse, Business Intelligence and Advanced Analytics
Analytics has received a massive boost because of the emergence of information technology. We are living in the era of big data. A plethora of data collected at every stage of the business process had created a need to extract knowledge out of the information. This overall process has three aspects to it
1. Data warehouse or data marts: transactional data is extracted-transformed and loaded (ETL) into a data model / schema for the purpose of analysis
2. Business Intelligence or dashboards: “as is” business reports
3. Predictive Analytics or Advanced Analytics: high-end statistical and data mining exercise
As the quantum of data is exponentially increasing, Hadoop and big data technologies are replacing the data warehouses. However, the thought process for business intelligence and predictive analytics – the focus of this article – will not change much. Let me try to distinguish between business intelligence and predictive Analytics using something I learned at a professional theater.
1.数据仓库或数据集市:事务数据被提取 - 转换和加载(ETL)到数据模型/模式中以进行分析
2.商业智能或仪表板:“按原样”业务报告
3.预测分析或高级分析:高端统计和数据挖掘练习
随着数据量的呈指数增长,Hadoop和大数据技术正在取代数据仓库。但是,商业智能和预测分析的思维过程 - 本文的重点 - 不会发生太大变化。让我尝试使用我在专业剧院学到的东西来区分商业智能和预测分析
5Ws for business intelligence & predictive Analytics – Lessons from Theater

5 Ws for Data Warehouse, Business Intelligence, and Advanced Analytics – by Roopam
I joined a professional theater group a few years ago. To understand the nuances of acting we started with improv or improvisation theater. This form of theater does not have a predefined script but the actors built the story while performing. Most people thought I was a good improv actor. However, the style of remembering dialogue while performing did not work very well for me and hence it was the end of my theater gig. However, I learn some good lessons from the whole experience. One of them was the five-Ws of deciphering a character to build the drama.
1. What had happened?
2. When did it happen?
3. Where did it happen?
4. Who was part of this?
5. Why did it happen?
Clearly, the first four questions are trying to report an as-is version of the reality – a descriptive model. This is exactly what the business intelligence professionals try to achieve through the fancy reporting platforms & software. The fifth question is the trickiest of the lot. The question that keeps scientists and inquisitive minds awake late at night.
几年前我加入了一个专业剧团。为了理解表演的细微差别,我们从即兴剧或即兴剧开始。这种形式的剧院没有预定义的剧本,但演员在表演时建立了故事。大多数人都认为我是一个很好的即兴演员。然而,在表演时记住对话的风格对我来说并不是很好,因此它是我戏剧演出的结束。但是,我从整个经历中学到了一些好的教训。其中一个是解读一个角色来制作戏剧的五个W.
1.发生了什么事?
2.什么时候发生的?
3它发生在哪里?
4谁是这个的一部分?
5.为什么会这样?
显然,前四个问题试图报告现实的现实版本 - 描述性模型。这正是商业智能专业人员试图通过花哨的报告平台和软件实现的目标。第五个问题是最棘手的问题。让科学家和好奇的头脑在深夜醒来的问题。
Newton’s Legacy
An apple falls from a tree. How difficult is it to answer the first four questions? Most of us can answer them with a help of a clock and a map. However, Isaac Newton answered the fifth question and his answer – Gravity. If he had stopped there, nobody would have remembered him after close to four hundred years since his birth. He gave a mathematical model to explain this phenomenon.

Replace apple and earth with any other objects and you have the general equation for the model. Albert Einstein did shatter the Newtonian notion of Gravity. However, this model still holds good for all problems of practical purposes and used extensively in rocket science.
Advanced analytics tries to facilitate the answer to the fifth question of why did something happen using predictive modeling. The combination of high-end statistical and data mining techniques along with analysts’ business acumen produces models that help organizations make informed decisions. Remember, this is just the beginning and causality is still a fair distance!
一棵苹果从树上掉下来。回答前四个问题有多难?我们大多数人都可以借助时钟和地图来回答这些问题。然而,Isaac Newton回答了第五个问题和他的回答 - Gravity。如果他已经停在那里,那么在他出生后近四百年后,没有人会想起他。他给出了一个数学模型来解释这种现象。
4重力
用任何其他物体替换苹果和地球,你就可以得到模型的一般公式。阿尔伯特爱因斯坦确实粉碎了牛顿的重力概念。然而,这种模型仍然适用于所有实际问题,并广泛用于火箭科学。
高级分析试图通过预测建模来回答第五个问题,即为什么会发生某些事情。高端统计和数据挖掘技术与分析师的商业敏锐度相结合,可以生成帮助组织做出明智决策的模型。请记住,这只是一个开始,因果关系仍然是一个公平的距离
Credit Scoring Models
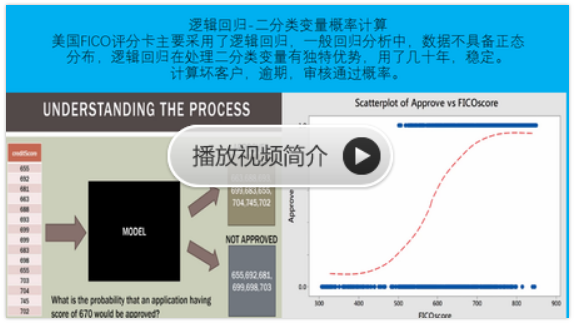
Credit scorecards are models to predict the probability of a borrower default on his/her loan. The following is a simplified version of credit score with three variables
Credit Score = Age + Loan to Value Ratio (LTV) + Installment (EMI) to Income Ratio (IIR)
信用记分卡是预测借款人违约贷款概率的模型。 以下是具有三个变量的信用评分的简化版本
信用评分=年龄+贷款与价值比率(LTV)+分期付款(EMI)与收入比率(IIR)
贷款价值比,英文loan to value,简写LTV,指贷款金额和抵押品价值的比例,多见于抵押贷款,如房产抵押贷款。

A 28-year-old man with the LTV of 75 and the IIR of 60 will have the score of 10+50+5 =65 and hence is a high credit risk.
一名28岁男子的LTV为75,IIR为60,他的得分为10 + 50 + 5 = 65,因此信用风险很高。
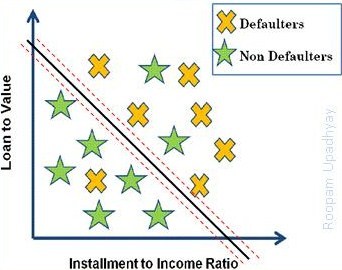
Classification of good & bad loans using two variables – LTV & IIR – by Roopam
Now the question is, how did we arrive at the bucket-wise score points and associated risk tables? By now, after going through the previous three articles of the series, you must have some idea how we will go about it. We have a historical list of good / bad borrowers (article 2) that we want to distinguish using predictor variables (article 3). There are several statistical & data mining techniques that could help us achieve our object such as
1. Decision tree
2. Neural Networks
3. Support Vector Machines
4. Probit Regression
5. Linear discriminant analysis
6. Logistic Regression
Logistic regression is the most commonly used technique for the purpose. We will explore more about logistic regression in the next article.
Sign-off Note
I must conclude this article by saying that the good analysts find a good mathematical model as beautiful as the model walking on the catwalk ramp.
现在的问题是,我们是如何得出存储分数和相关风险表的? 到目前为止,在完成系列的前三篇文章之后,你必须知道我们将如何去做。 我们有一个好/坏借款人的历史清单(第2条),我们希望使用预测变量来区分(第3条)。 有几种统计和数据挖掘技术可以帮助我们实现我们的目标,例如
1.决策树
2.神经网络
3.支持向量机
4.概率回归
5.线性判别分析
6. Logistic回归
Logistic回归是最常用的技术。 我们将在下一篇文章中探讨有关逻辑回归的更多信息。
签字笔记
我必须在结束本文时说,优秀的分析师找到了一个很好的数学模型,就像模特走在T台上一样漂亮。
Credit Scorecards – Logistic Regression (part 5 of 7)
http://ucanalytics.com/blogs/credit-scorecards-logistic-regression-part-5/
A Primer on Logistic Regression – Are you Happy?

Logistic regression for happiness- by Roopam
A few years ago, my wife and I took a couple of weeks’ vacation to England and Scotland. Just before boarding the British Airway’s plane, an air-hostess informed us that we were upgraded to business class. Jolly good! What a wonderful start to the vacation. Once we got onto to the plane, we got another tempting offer for a further upgrade to the first class. However, this time, there was a catch – just one seat was available. Now that is a shame, of course, we could not take this offer. The business class seats were fabulous before the first class offer came – by the way, all free upgrades. This is the situation behavioral economist describe as relativity & anchoring – in plain English comparison. Anchoring or comparison is at the root of pricing strategies in business and also to all the human sorrow. However, eventually the vacation mood took over and we enjoyed the business class thoroughly. Humans are phenomenally good at adjusting to the situation in the end and enjoy it as well. You will find some of the happiest faces with people in the most difficult situations. Here is a quote by Henry Miller “I have no money, no resources, no hopes. I am the happiest man alive”. Human behavior is full of anomaly – full of puzzles. The following is an example to strengthen this thesis.
几年前,我和妻子在英格兰和苏格兰度过了几个星期的假期。就在登上英国航空公司的飞机之前,一名空姐告诉我们,我们已升级为商务舱。快乐!度假真是一个美好的开始。一旦我们登上飞机,我们又获得了另一个诱人的提议,可以进一步升级到头等舱。然而,这一次,有一个问题 - 只有一个座位可用。当然,这是一种耻辱,我们无法接受这个提议。在提供头等舱优惠之前,商务舱座位非常棒 - 顺便说一下,所有免费升级。这是行为经济学家描述为相对论和锚定的情况 - 用简单的英语比较。锚定或比较是企业定价策略的根源,也是所有人类悲伤的根源。然而,最终度假心情接管了,我们彻底享受了商务舱。人类在适应最终情况方面非常擅长并享受它。在最困难的情况下,你会发现一些最快乐的面孔。以下是亨利米勒的一句话:“我没有钱,没有资源,没有希望。我是最幸福的人“。人类的行为充满了异常 - 充满了谜题。以下是加强本论文的一个例子
列侬,麦卡特尼,哈里森和贝斯特是这个星球上最着名的乐队 - 甲壳虫乐队的成员。 好的,我知道你发现了这个错误。 到现在为止,你必须说出正确的名字:John Lennon,Paul McCartney,George Harrison和Ringo Starr,而不是Pete Best。 实际上,Ringo Starr是Pete Best的替代品,Pete Best是甲壳虫乐队的原始常规鼓手。 皮特一定是被摧毁了,看到他的伙伴们在落后的时候冉冉升起。 错了,在Google上搜索他 - 他是所有人中最快乐的披头士乐队。 现在这是违反直觉的,我想我们不知道是什么让我们开心。
正如在前一篇文章中所承诺的那样,在本文中,我将尝试使用逻辑回归来探索幸福 - 这种技术广泛用于记分卡开发。

Source: flicker.com
Lennon, McCartney, Harrison, and Best are the members of the most famous band ever on the planet – the Beatles. Ok, I know you have spotted the error. By now your must have uttered out the right names: John Lennon, Paul McCartney, George Harrison and Ringo Starr not Pete Best. Actually, Ringo Starr was the replacement for Pete Best, the original regular drummer for the Beatles. Pete must have been devastated seeing his partners rising to glory while he was left behind. Wrong, search for him on Google – he is the happiest Beatle of all. Now that is counter intuitive, I guess we do not have a clue what makes us happy.
As promised in a previous article, in this article I will attempt to explore happiness using logistic regression – the technique extensively used in scorecard development.
我是一位彻底的经验主义者 - 支持基于事实的管理。 因此,让我设计一个快速而肮脏的实验*来生成数据来评估幸福感。 我们的想法是确定影响我们整体幸福感的因素/变量。 让我列出一个生活在城市中的工作成年人的代表性因素列表:
Logistic Regression – An Experiment
I am a thorough empiricist – a proponent of fact-based management. Hence, let me design a quick and dirty experiment* to generate data to evaluate happiness. The idea is to identify the factors / variables that influence our overall happiness. Let me present a representative list of factors for a working adult living in a city:

Now, throw in some other factors to the above list such as – random act of kindness or an unplanned visit to a friend. As you could see, the above list can easily be expanded (recall the article on variable selection- article 3). This is a representative list and you will have to create your own to figure out factors that influence your level of happiness.
The second part of the experiment is to collect data. This is like maintaining a diary only this one will be in Microsoft Excel. Every night before sleeping, you could assess your day and fill up numbers in the Spreadsheet along with your overall level of happiness for the day (as shown in the figure below).

*I am calling this a quick and dirty experiment for the following reasons (1) It’s not a well thought out experiment but is created more to illustrate how logistic regression works (2) the observer and the observed are same in this experiment which might create a challenge for objective measurement.
After a couple of years of data collection, you will have enough observations to create a model – a logistic regression model in this case. We are trying to model feeling of happiness (column B) with other columns (C to I) in the above data set. If we plot B on the Y-axis and the additive combination of C to I (we’ll call it Z) on the X-axis it will look something like the plot shown below.

The idea behind logistic regression is to optimize Z in such a way that we get the best possible distinction between happy and sad faces, as achieved in the plot above. This is a curve-fitting problem with sigmoid function (the curve in violet) as the choice of function.
I would recommend using dates of observations (column A) in our model; this might give an interesting influence of seasons on our mood.
逻辑回归背后的想法是以这样的方式优化Z,使得我们在快乐和悲伤面孔之间得到最佳区分,如上图所示。 这是一个曲线拟合问题,其中sigmoid函数(紫色曲线)作为函数的选择。
我建议在我们的模型中使用观察日期(A栏); 这可能会给季节带来有趣的影响。
Applications in Banking and Finance
This is exactly what we do in case of analytical scorecards such as credit scorecards, behavioral scorecards, fraud scorecards or buying propensity models. Just replace happy and sad faces with …
• Good and Bad borrowers
• Fraud and genuine cases
• Buyers and non-buyers
…. for the respective cases and you have the model. If you remember in the previous article (4), I have shown a simple credit scorecard model: Credit Score = Age + Loan to Value Ratio (LTV) + Instalment (EMI) to Income Ratio (IIR)
A straightforward transformation of the sigmoid function will help us arrive at the above equation of the line. This is the final link to arrive at the desired scorecard.
Variable Transformation in Credit Scorecards

The Swordsmith – by Roopam
I loved the movie Kill-Bill, both parts. In the first part, I enjoyed when Uma Thurman’s character went to Japan to get a sword from Hattori Hanzō, the legendary swordsmith. After learning about her motive, he agrees to make his finest sword for her. Then Quentin Tarantino, director of the movie, briefly showed the process of making the sword. Hattori Hanzō transformed a regular piece of iron to the fabulous sword – what a craftsman. This is fairly similar to how analysts perform transformation of the sigmoid function to the linear equation. The difference is that analysts use mathematical tools rather than hammers and are not as legendary as Hattori Hanzō.
我喜欢电影Kill-Bill这两部分。 在第一部分中,当Uma Thurman的角色去日本从传说中的剑士HattoriHanzō手中拿剑时,我很享受。 在了解了她的动机之后,他同意为她做出最好的剑。 然后电影导演昆汀·塔伦蒂诺(Quentin Tarantino)简要介绍了制作剑的过程。 HattoriHanzō将一块普通的铁片变成了神话般的剑 - 这真是一个工匠。 这与分析师如何将S形函数转换为线性方程非常相似。 不同之处在于,分析师使用数学工具而不是锤子,并不像HattoriHanzō那样具有传奇色彩。
Reject Inference
Reject inference is a distinguishing aspect about credit or application scorecards which is different from all other classification models. For the application scorecards, the development sample is biased because of the absence of performance for rejected loans. Reject inference is a way to rectify this shortcoming and removing the bias from the sample. We will discuss reject inference in detail in some later article on YOU CANalytics.
拒绝推断是信用或应用记分卡的一个显着方面,它与所有其他分类模型不同。 对于应用记分卡,由于拒绝贷款缺乏绩效,开发样本存在偏差。 拒绝推断是一种纠正这一缺点并消除样本偏差的方法。 我们将在后面有关您的CANalytics的文章中详细讨论拒绝推断。
Sign-off Note
Now that we have our scorecard ready the next task is to validate the predictive power of the scorecard. This is precisely what we will do in the next article. See you soon.
Credit Scorecards – Model Validation (Part 6 of 7)
http://ucanalytics.com/blogs/credit-scorecards-model-validation-part-6/
There are only two ways to live your life. One is as though nothing is a miracle. The other is as though everything is a miracle.
– Albert Einstein
A Commentary on Curiosity

Advanced Analytics Professional: An Unbiased Observer – by Roopam
I think the best way to appreciate and enjoy the trivial is to travel. When I say trivial, it includes doorknobs, posters, letterboxes, graffiti and everything we never bother to turn our heads for in our own city. I experienced the same last week while traveling with my wife across Florence and Tuscany. I think one’s level of awareness and curiosity goes up many-fold while traveling. In Florence, we stayed at a lovely bed-and-breakfast named Fiorenza. The breakfast was good and the people even better. There we met this amicable family from the UK with a year old baby named Owen and his 7-year-old sister Kyra. Owen and Kyra were playing hide and seek while having their breakfast. Kyra hid behind the same chair repeatedly and jumped out to reveal herself to her younger brother. Owen was pleasantly surprised every time during this process. All humans are born curious. However, they lose it as they grow older and get familiar with things. The phenomenon could be the reason why we never turn our heads for the trivial in our own city.
我认为欣赏和享受琐事的最佳方式是旅行。当我说琐碎的时候,它包括门把手,海报,信箱,涂鸦以及我们从未在我们自己的城市中转过头来做的一切。上周我与妻子一起在佛罗伦萨和托斯卡纳旅行时经历了同样的经历。我认为一个人的意识水平和好奇心在旅行时会增加很多倍。在佛罗伦萨,我们住在一个可爱的住宿加早餐,名为Fiorenza。早餐很好,人们甚至更好。在那里,我们遇到了这个来自英国的友好家庭,一个名叫Owen的婴儿和他7岁的妹妹Kyra。欧文和凯拉在吃早餐时玩捉迷藏。凯拉反复躲在同一把椅子后面,跳出来向她的弟弟透露自己。欧文在这个过程中每次都感到惊喜。所有人都天生好奇。然而,随着年龄的增长和熟悉事物,他们会失去它。这种现象可能是我们永远不会为自己城市中的琐事而烦恼的原因。
Curiosity and Data Science Career
Being curious and aware requires constant energy and effort. Perhaps, humans have the natural tendency to slip into a low energy state. Nonetheless, this is particularly dangerous for analysts since their job requires finding meaning in something that seems mundane to others. In my opinion, the biggest challenge for analytics is not the sophistication of statistical algorithms and enhancement of computing power, but for its practitioners to stay curious and constantly ask questions. Zen Buddhists try to achieve cosmic awareness by living in the moment. If that is too difficult, I would recommend that treat your job like a wonderful travel destination and be a good tourist – curious and aware.
Ok, so that was a bit of a detour from our original discussion on scorecards. However, there are a couple of reasons for telling you the above: primarily, to tell you why I was late in posting this part of the series. Secondly, I would like us to have a discussion on the importance and challenges of being curious at work and life in general. I already have a few examples in mind i.e. Louis Pasteur and Edward Lorenz but that is for later.
Now, let’s continue with the topic for this part i.e. model evaluation.
好奇心与数据科学事业
充满好奇和意识需要不断的精力和努力。也许,人类有自然倾向于陷入低能量状态。尽管如此,这对分析师来说尤其危险,因为他们的工作需要在对他人而言看似平凡的事情中找到意义。在我看来,分析的最大挑战不是统计算法的复杂性和计算能力的提高,而是让其从业者保持好奇并不断提出问题。禅宗佛教徒试图通过生活在当下来实现宇宙意识。如果这太难了,我建议把你的工作当作一个很棒的旅游目的地,做个好游客 - 好奇又有意识。
好的,所以这与我们对记分卡的原始讨论有点迂回。但是,有几个原因告诉你上面的内容:主要是告诉你为什么我在发布这个系列的这一部分时迟到了。其次,我希望我们讨论一般对工作和生活充满好奇的重要性和挑战。我已经有一些例子,即路易斯巴斯德和爱德华洛伦兹,但这是为了以后。
现在,让我们继续讨论这个部分的主题,即模型评估。
Model Validation & Evaluation

Model Evaluation & Validation: the test of the pudding is in the eating – by Roopam
When I was in high school, I joined a cricket academy during the summer vacations. Cricket is a game quite similar to baseball. I shall use baseball terminology in parenthesises for everyone to understand. The design of the training camp was to train for about a month followed by a full game with kids at same skill-level from another club. There was this tall and lean kid with us in the camp; he was the star bowler (pitcher) throughout during the training sessions. He used to bowl (pitch) some of the best Yorkers (curve balls). We were quite sure he would outperform everyone in the game. We ask him to open the bowling, his first bowl went for a six (home run) followed by several more. Maybe it was a mix match pressure, expectations, and the crowd but his performance was an absolute disaster. Later the coach told us what happened was not unusual and he had seen this several times before. At higher levels, the game is played not on the ground but the space between the ears. Clearly, he was referring to players’ presence of mind and temperament.
当我在高中时,我在暑假期间加入了板球学院。 Cricket是一款与棒球非常相似的游戏。我将在括号中使用棒球术语,让每个人都能理解。训练营的设计是训练大约一个月,然后与来自另一个俱乐部的相同技能水平的孩子进行完整的比赛。在营地里有一个高大瘦弱的孩子和我们在一起;在训练期间,他一直是明星投手(投手)。他过去常常把一些最好的Yorkers(曲线球)弄成一团糟。我们非常肯定他会在游戏中胜过每个人。我们要求他打开保龄球,他的第一个碗去了六个(本垒打),然后是几个。也许这是混合比赛压力,期望和人群,但他的表现是绝对的灾难。后来教练告诉我们发生的事情并不罕见,他以前曾多次见过这件事。在更高的级别,游戏不是在地面上播放,而是在耳朵之间的空间播放。显然,他指的是球员的思想和气质。
Sampling Strategy for Model Validation
As the famous saying goes, the test of the pudding is in the eating. One could be a star on the training fields but a complete flop in the match situation. The same is true for an analytical model as well. A model, after going through a round of training (Part 5 of the series) goes through a several rounds of testing.
1. Out of sample test: remember article 2, where we have divided our sample into the training and the test sample. The first level of testing happens on the holdout or test sample. The test sample needs to perform as well as the training sample. Let us come back to this in the next section when I will discuss the measures for performance and ROC curve.
2. Out of time sample test: since the model was built on a sample of the portfolio with reasonable vintage (refer to Part 2), the analyst would like to test the performance of a more recent portfolio. The number of bad borrowers (90+ DPD) in this out of time sample will be certainly less but the overall trend of good/bad ratio against scores will still be a good indicator for model performance. Additionally, the analyst could relax the condition for bad loans and consider 30+ DPD as bad. Again, the overall trend should match the scorecard estimations.
3. On field test: this is where the test of the pudding is; the analyst needs to be completely aware of any credit policy changes that the bank has gone through since the scorecard is developed and more importantly, the impact the changes will have on the scorecard. Always remember not every policy change will influence the scorecard – a good business understanding and a bit of common sense really help here. A regular monitoring and accordingly calibrating the scorecard is a good way to keep it updated.
正如俗名所说,布丁的考验就在于吃。一个人可能是训练场上的明星,但在比赛情况下完全失败了。对于分析模型也是如此。经过一轮训练(系列的第5部分)后,模型经过了几轮测试。
1.train VS test样品外测试:记住第2条,我们将样品分成培训和测试样品。第一级测试发生在保持或测试样本上。测试样本需要与训练样本一样好。让我们在下一节回到这一点,我将讨论性能和ROC曲线的措施。
2.OOT超时样本测试:由于该模型是基于合理年份的投资组合样本(参见第2部分),因此分析师希望测试最近投资组合的表现。在这段时间样本中,不良借款人(90+ DPD)的数量肯定会减少,但是对比分的好/坏比率的整体趋势仍将是模型表现的良好指标。此外,分析师可以放松不良贷款的条件,并认为30+ DPD是坏的。同样,整体趋势应该与记分卡估计相匹配。
3.政策变化对模型影响大
场景测试:这是布丁测试的地方;分析师需要完全了解银行自开发记分卡以来所经历的任何信贷政策变化,更重要的是,变更将对记分卡产生的影响。永远记住不是每个政策变化都会影响记分卡 - 良好的商业理解和一些常识在这里真的很有帮助。定期监控并相应地校准记分卡是保持更新的好方法。
Performance Tests for Model Validation
There are several ways to test the performance of the scorecard such as confusion matrix, KS statistics, Gini and area under ROC curve (AUROC) etc. The KS statistics is widely used metric in scorecards development. However, I personally prefer the AUROC to the others. I must add the Gini is a variant of the AUROC. The reason for my liking of the AUROC could be my formal training in Physics and engineering. I think it is a more holistic measure and lets the analyst visually analyze the model performance. I prefer graph and visual statistics any day to raw numbers.
有几种方法可以测试记分卡的性能,例如混淆矩阵,KS统计,基尼系数和ROC曲线下面积(AUROC)等.KS统计量是记分卡开发中广泛使用的度量标准。 但是,我个人更喜欢AUROC和其他人。 我必须添加Gini是AUROC的变种。 我喜欢AUROC的原因可能是我在物理和工程方面的正式培训。 我认为这是一个更全面的衡量标准,让分析师可以直观地分析模型的表现。 我更喜欢图形和视觉统计数据,以及原始数字。

ROC Curve: for Credit Scorecard Model Validation and Evaluation – by Roopam
The adjacent graph shows a ROC. The two axes on the curve are true and false positive rates. As expected, the plot informs about the level of prediction for the model. A perfect model will perfectly segregate good and bad cases. Hence, you will get 100% true positives in the beginning (i.e. absolute lift) as shown with the green curve in the graph. However, like anything in life perfection does not exist. As they say – If it is too good to be true it probably is. On the other extreme is a worthless model, curve marked in red. Anything close to or below the red curve is as good as tossing a coin, then why to bother with the effort to build a model. Finally, a typical scorecard ROC will look like the blue curve. The AUROC for a usual credit-scoring model is within 70 to 85, higher the better. However, for some fraud and insurance models, a slightly above 60 is an acceptable ROC. Again, analysts should be sure about the business benefits from the scorecard before finalizing the ROC. A simple cost-benefit analysis helps significantly before finalizing the model and reporting it to the top management.
相邻的图表显示了ROC。曲线上的两个轴是真实和误报率。正如预期的那样,该图表通知了该模型的预测水平。一个完美的模型将完美地隔离好的和坏的案件。因此,您将在开始时获得100%真实的正数(即绝对提升),如图中的绿色曲线所示。但是,生活中的任何事物都不存在完美。正如他们所说 - 如果真是太好了,那可能就是这样。另一个极端是一个毫无价值的模型,曲线标记为红色。任何靠近或低于红色曲线的东西都和投掷硬币一样好,那么为什么要费心去打造一个模型。最后,典型的记分卡ROC看起来像蓝色曲线。通常的信用评分模型的AUROC在70到85之间,越高越好。但是,对于某些欺诈和保险模式,略高于60的是可接受的ROC。同样,分析师应该在最终确定ROC之前确保记分卡的业务收益。在最终确定模型并将其报告给最高管理层之前,简单的成本效益分析可以显着提供帮助。
Sign-off Note
I hope after reading this, you will pick up your camera and visit that unexplored nook at the corner of the street – and be ready for some wonderful surprises!
References
1. Credit Risk Scorecards: Developing and Implementing Intelligent Credit Scoring – Naeem Siddiqi
2. Credit Scoring for Risk Managers: The Handbook for Lenders – Elizabeth Mays and Niall Lynas
Credit Scorecards – Business Integration of Predictive Analytics (part 7 of 7)
http://ucanalytics.com/blogs/credit-scorecards-predictive-analytics-part-7/
Columbus – A lesson in Leadership

The leader – by Roopam
Christopher Columbus – I have adored this man for various reasons at various stages of my life. At seven, I adored him because his mistakes were applauded and became part of history – Columbus mistook Native Americans for Indians because he thought he had landed in Asia rather than the Americas. While my mistakes were circled with red ink and awarded zero, I felt that was unfair – Oh Columbus, you lucky bastard! At seventeen, I adored him because he was a rebel as he went against the popular belief about the planet and sailed in the opposite direction – Oh Columbus, you non-conformist! Now that I feel I know him a little better, I adore him for setting the direction others can follow. He was not the first one to reach the Americas from Europe, although he did not know this. There are references of others achieving this feat before him. However, he was the one who sensitized Europe towards America. At present, the predominant population in the Americas is of European origin. So many people must have followed directions set forth by Columbus – Oh Columbus, you leader!
15th August – today India, the largest democracy, is celebrating its Independence day. Let us take a moment to applaud the spirit of Columbus in all of us – the explorer, the free thinker – before venturing into the integration of predictive analytics with business processes. In addition, yes, Columbus will pave the way for us to understand this integration better.
克里斯托弗·哥伦布 - 我在生命的各个阶段因各种原因而崇拜这个男人。七岁时,我很尊敬他,因为他的错误得到了掌声并成为了历史的一部分 - 哥伦布把印第安人误认为印第安人,因为他认为他已经登陆亚洲而不是美洲。虽然我的错误被红色墨水圈起来并且被授予零,但我觉得那是不公平的 - 哦哥伦布,你这个幸运的混蛋!十七岁的时候,我很尊敬他,因为他是一个反叛者,因为他违背了对这个星球的普遍看法,并朝着相反的方向航行 - 哦哥伦布,你是不守规矩的!现在我觉得我对他的了解要好一点,我崇拜他,因为他设定了其他人可以遵循的方向。他不是第一个从欧洲到达美洲的人,尽管他不知道这一点。在他之前有其他人提到这一壮举。然而,他是那个使欧洲对美国敏感的人。目前,美洲的主要人口来自欧洲。很多人必须遵循哥伦布提出的指示 - 哦哥伦布,你的领导!
8月15日 - 今天,最大的民主国家印度正在庆祝其独立日。在冒险进行预测分析与业务流程的整合之前,让我们花点时间为我们所有人 - 探险家,自由思想家 - 赞扬哥伦布的精神。此外,是的,哥伦布将为我们更好地理解这种整合铺平道路。
Integrating Predictive Analytics with Business Processes

Let us accept it, probability and statistics, despite being logical and right, do not come naturally to us humans. Numerous books and theses have repeatedly proven this fact*. The whole furor about the solution to the Monty Hall problem (read the article) is a testimonial to this thesis. Once we have grounded this fact, let us go back to Columbus. Like him, as an analyst, once you have explored the exotic land you want to show it to others. You want them to appreciate it and make it their home.
让我们接受它,概率和统计,尽管是合乎逻辑的,但是对我们人类来说并不自然。 许多书籍和论文反复证明了这一事实*。 关于Monty Hall问题解决方案的全部意见(阅读文章)是本论文的证明。 一旦我们接受了这个事实,让我们回到哥伦布。 像他一样,作为一名分析师,一旦你探索了异国情调的土地,你就要向别人展示它。 你希望他们欣赏它并将它作为自己的家。
*Read Daniel Kahneman’s Thinking, Fast and Slow
The Ace 王牌of Advanced Analytics Success
The sole purpose of analytics is business enhancement and growth. The intellectual exercise has to translate into tangible returns. This is by no means an easy task. Let me present the ACE of integration of predictive analytics with business processes. I am feeling like a great business Guru to coin this term ACE – I know you readers are generous to let me get away with some self-indulgence. In fact, could someone tell me how to get this copyrighted? ACE stands for Accessible, Communication-&-Education, and Ease-of-Use.

The ACE of Predictive Analytics project success – by Roopam
Accessible: All humans are involved-creatures. We want to be part of the new. This is also true for that grumpy manager resisting change in the corner office. He wants to be part of the change. He is also ready for controlled experiments. Make him part of it. This has helped me significantly while implementation of advanced analytics solutions. The onus is with the analyst to constantly work with the concern parties. Their knowledge will only enhance the research. Yes, it is time-consuming and could also hurt your ego at times but is absolutely essential for the project’s success.
Communication-&-Education: All humans are curious creatures. We all love to get educated. Analytics projects are also about educating the decision maker about aspects of predictive analytics including pitfalls. As we have discussed, statistics is not an intuitive science. However, you will find most people more than willing to listen to you. It is about communicating your excitement for the field and the results. If they are not listening to you – try harder and be creative.
Ease-of-use: Most humans do not like unnecessary complications in their life and analytics is no exception. This is where an astute use of information technology to integrate analytics with business process is an absolute must. For example, the first versions of credit scorecards I saw were excel based standalone applications. Here, the credit underwriters were punching in the information about the borrower all over again. No wonder they hated it. It is not that difficult to integrate the underwriting application with the scorecard, where no extra effort is required for the users. The job of analytics professional is not over till he/she drives the application usage to generate business benefits.
Sign-off Remark
Wow! Am feeling good after completing this seven-part series (part 1 -7) on Analytical Scorecards, trust me it is good fun writing. I know you are reading the articles because of all the positive feedback I am receiving. If you would like to write some articles on YOU CANalytics, please drop a mail on roopam.up@gmail.com or contact me. I’ll create an author’s account for you. Look forward to hearing back from you.
See you soon with a new topic on Analytics.
分析的唯一目的是业务增强和增长。智力活动必须转化为实际回报。这绝不是一件容易的事。让我介绍预测分析与业务流程集成的ACE。我感觉自己是一个伟大的商业大师,可以用这个术语来证明ACE - 我知道读者很慷慨,让我放弃一些自我放纵。事实上,有人可以告诉我如何获得这个受版权保护的版权? ACE代表Accessible,Communication - & - Education和Ease-of-Use。
无障碍:所有人都参与其中 - 生物。我们希望成为新的一部分。对于那个脾气暴躁的经理来说,抵制角落办公室的变革也是如此。他希望成为变革的一部分。他也准备好进行对照实验。让他成为一部分。在实施高级分析解决方案时,这对我有很大帮助。分析师有责任不断与关注方合作。他们的知识只会加强研究。是的,这很费时,有时也会伤害你的自我,但对于项目的成功绝对必不可少。
沟通 - 和 - 教育:所有人类都是好奇的生物。我们都喜欢接受教育。分析项目还涉及向决策者提供关于预测分析(包括陷阱)方面的教育。正如我们所讨论的,统计学不是一门直观的科学。但是,你会发现大多数人都愿意听你的。它是关于沟通您对该领域和结果的兴奋。如果他们没有听你的话 - 努力尝试并发挥创意。
易于使用:大多数人不喜欢生活中不必要的麻烦,分析也不例外。在这里,精明地使用信息技术将分析与业务流程集成是绝对必要的。例如,我看到的信用记分卡的第一个版本是基于excel的独立应用程序。在这里,信用承销商正在重新审视借款人的信息。难怪他们讨厌它。将承保应用程序与记分卡集成并不困难,因为记分卡不需要用户额外的努力。分析专业人员的工作还没有结束,直到他/她推动应用程序使用以产生商业利益。
https://study.163.com/course/courseMain.htm?courseId=1005988013&share=2&shareId=400000000398149(博主录制,2K超清分辨率)


 4266
4266


 被折叠的 条评论
为什么被折叠?
被折叠的 条评论
为什么被折叠?
 到【灌水乐园】发言


