AWS Big Data Blog
Converging Data Silos to Amazon Redshift Using AWS DMS
Organizations often grow organically—and so does their data in individual silos. Such systems are often powered by traditional RDBMS systems and they grow orthogonally in size and features. To gain intelligence across heterogeneous data sources, you have to join the data sets. However, this imposes new challenges, as joining data over dblinks or into a single view is extremely cumbersome and an operational nightmare.
This post walks through using AWS Database Migration Service (AWS DMS) and other AWS services to make it easy to converge multiple heterogonous data sources to Amazon Redshift. You can then use Amazon QuickSight, to visualize the converged dataset to gain additional business insights.
AWS service overview
Here’s a brief overview of AWS services that help with data convergence.
AWS DMS
With DMS, you can migrate your data to and from most widely used commercial and open-source databases. The service supports homogenous migrations such as Oracle to Oracle, as well as heterogeneous migrations between different database platforms, such as Oracle to Amazon Aurora or Microsoft SQL Server to MySQL. It also allows you to stream data to Amazon Redshift from any of the supported sources including:
- Amazon Aurora
- PostgreSQL
- MySQL
- MariaDB
- Oracle
- SAP ASE
- SQL Server
DMS enables consolidation and easy analysis of data in the petabyte-scale data warehouse. It can also be used for continuous data replication with high availability.
Amazon QuickSight
Amazon QuickSight provides very fast, easy-to-use, cloud-powered business intelligence at 1/10th the cost of traditional BI solutions. QuickSight uses a new, super-fast, parallel, in-memory calculation engine (“SPICE”) to perform advanced calculations and render visualizations rapidly.
QuickSight integrates automatically with AWS data services, enables organizations to scale to hundreds of thousands of users, and delivers fast and responsive query performance to them. You can easily connect QuickSight to AWS data services, including Amazon Redshift, Amazon RDS, Amazon Aurora, Amazon S3, and Amazon Athena. You can also upload CSV, TSV, and spreadsheet files or connect to third-party data sources such as Salesforce.
Amazon Redshift
Amazon Redshift delivers fast query performance by using columnar storage technology to improve I/O efficiency and parallelizing queries across multiple nodes. Amazon Redshift is typically priced at 1/10th of the price of the competition. We have many customers running petabyte scale data analytics on AWS using Amazon Redshift.
Amazon Redshift is also ANSI SQL compliant, supports JDBC/ODBC, and is easy to connect to your existing business intelligence (BI) solution. However, if your storage requirement is in the 10s of TB range and requires high levels of concurrency across small queries, you may want to consider Amazon Aurora as the target converged database.
Walkthrough
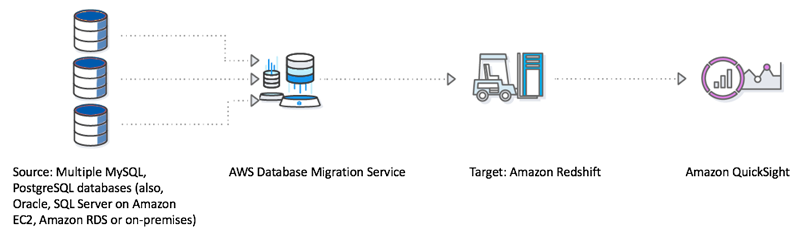
Assume that you have an events company specializing on sports, and have built a MySQL database that holds data for the players and the sporting events. Customers and ticket information is stored in another database; in this case, assume it is PostgresSQL and this gets updated when customer purchases tickets from our website and mobile apps. You can download a sample dataset from the aws-database-migration-samples GitHub repo.
These databases could be anywhere: at an on-premises facility; on AWS in Amazon EC2 or Amazon RDS, or other cloud provider; or in a mixture of such locations. To complicate things a little more, you can assume that the lost opportunities (where a customer didn’t complete buying the ticket even though it was added to the shopping cart) are streamed via clickstream through Amazon Kinesis and then stored on Amazon S3. We then use AWS Data Pipeline to orchestrate a process to cleanse that data using Amazon EMR and make it ready for loading to Amazon Redshift. The clickstream integration is not covered in this post but was demonstrated in the recent Real-time Clickstream Anomaly Detection with Amazon Kinesis Analytics post.
Architecture
In this solution, you use DMS to bring the two data sources into Amazon Redshift and run analytics to gain business insights. The following diagram demonstrates the proposed solution.
After the data is available on Amazon Redshift, you could easily build BI dashboards and generate intelligent reports to gain insights using Amazon QuickSight. You could also take this a step further and build a model using Amazon Machine Learning. Amazon Machine Learning uses powerful algorithms to create ML models by finding patterns in your existing data stored in Amazon S3, or Amazon Redshift. It is also highly scalable and can generate billions of predictions daily, and serve those predictions in real time and at high throughput.
Creating source databases
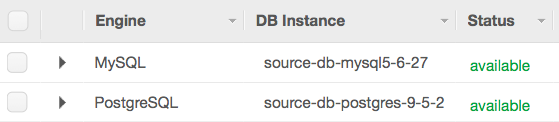
For the purposes of this post, create two RDS databases, one with a MySQL engine, and the other with PostgreSQL and then load some data. These represent a real-life scenario where databases could be located on-premises, on AWS, or both. Just as in real life, there may be more than two source databases; the process described in this post would still be reasonably similar.
Follow the steps in Tutorial: Create a Web Server and an Amazon RDS Database to create the two source databases. Use the links from the main tutorial page to see how to connect to specific databases and load data. For more information, see:
- Creating a DB Instance Running the MySQL Database Engine
- Creating a DB Instance Running the PostgreSQL Database Engine
Make a note of the security group that you create and associate all the RDS instances with it. Call it “MyRDSSecurityGroup”.
Afterward, you should be able to see all the databases listed in the RDS Instances dashboard.
Setting up a target Amazon Redshift cluster
Set up a two-node cluster as shown below, with a cluster name similar to “consolidated-dwh” and a database named similar to “mydwh”. You could also set up a one-node cluster based on the instance type; the instance type may be available on the AWS Free Tier.
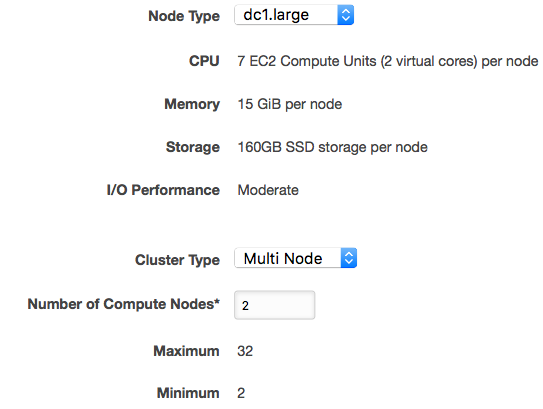
In the next step, choose Publicly Accessible for non-production usage to keep the configuration simple.
Also, for simplicity, choose the same VPC where you have placed the RDS instances and include the MyRDSSecurityGroup in the list of security groups allowed to access the Amazon Redshift cluster.
Setting up DMS
You can set up DMS easily, as indicated in the AWS Database Migration Service post on the AWS blog. However, rather than using the wizard, you may take a step-by-step approach:
- Create a replication instance.
- Create the endpoints for the two source databases and the target Amazon Redshift database.
- Create a task to synchronize each of the sources to the target.
Create a replication instance
In the DMS console, choose Replication instances, Create replication instance. The instance type you select depends on the data volume you deal with. After setup, you should be able to see your replication instance.

Create endpoints
In the DMS console, choose Endpoints, Create endpoint. You need to configure the two source endpoints representing the PostgreSQL and MySQL RDS databases. You also need to create the target endpoint by supplying the Amazon Redshift database that you created in the previous steps. After configuration, the endpoints look similar to the following screenshot:

Create a task and start data migration
You can rely on DMS to create the target tables in your target Amazon Redshift database or you may want to take advantage of AWS Schema Conversion Tool to create the target schema and also do a compatibility analysis in the process. Using the AWS Schema Conversion Tool is particularly useful when migrating using heterogeneous data sources. For more information, see Getting Started with the AWS Schema Conversion Tool.
For simplicity, I avoided using the AWS Schema Conversion Tool in this post and used jump to DMS to create the target schema and underlying tables and then set up the synchronization between the data sources and the target.
In the DMS console, choose Tasks, Create Tasks. Fill in the fields as shown in the following screenshot:
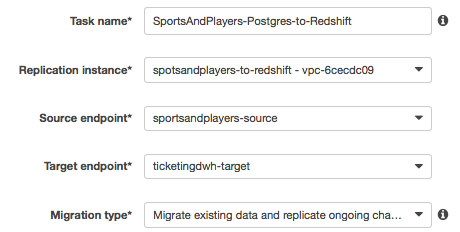
Note that given the source is RDS MySQL and you chose Migrate data and replicate on going changes, you need to enable bin log retention. Other engines have other requirements and DMS prompts you accordingly. For this particular case, run the following command:
call mysql.rds_set_configuration('binlog retention hours', 24);Now, choose Start task on create. In the task settings, choose Drop tables on target to have DMS create the tables, if you haven’t already created the target tables using the AWS Schema Conversion Tool, as described earlier. Choose Enable logging but note that this incurs additional costs as the generated CloudWatch logs require storage.
In the table mappings, for Schema to migrate, ensure that the correct schema has been selected from the source databases. DMS creates the schema on the target if it does not already exist.
Repeat for the other data source, choosing the other source endpoint and the same Amazon Redshift target endpoint. In the table mappings section, choose Custom and customize as appropriate. For example, you can specify the schema names to include and tables to exclude, as shown in the following screenshot:
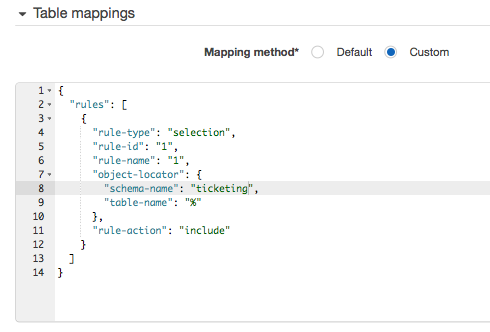
Using this custom configuration, you can perform some minor transformations, such as down casing target table names, or choosing a different target schema for both sources.
After both tasks have successfully completed, the Tasks tab now looks like the following:

Running queries on Amazon Redshift
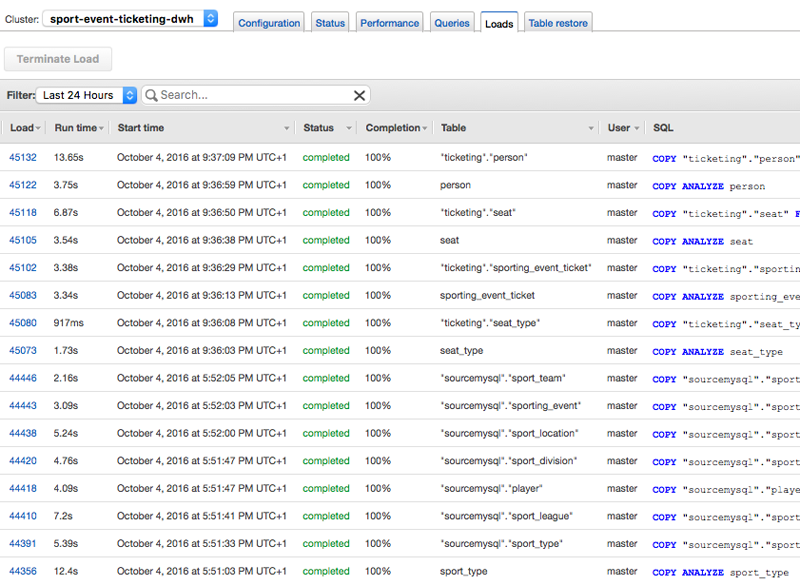
In Amazon Redshift, select your target cluster and choose Loads. You can see all operations that DMS performed in the background to load the data from the two source databases into Amazon Redshift.
Ensure change data capture is working
Generate additional data on Amazon RDS PostgreSQL in the ticketing.sporting_event_ticket by running the script provided in the generate_mlb_season.sql aws-database-migration-samples GitHub repository. Notice that the tasks have caught up and are showing the migration in progress. You can also query the target tables and see that the new data is in the target table.
Visualization options
Set up QuickSight and configure your data source to be your Amazon Redshift database. If you have a Redshift cluster in the same account and in the same region, it will appear when you clock Redshift (Auto-discovered) from the data sets page, as shown below.
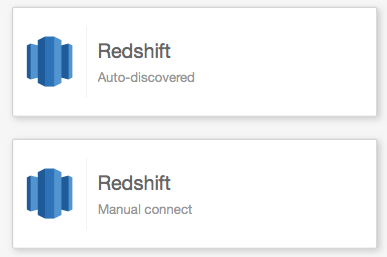
Access to any other Redshift cluster can be configured as follows using the Redshift (Manual connect) link:

Now, create your data set. Choose New Data Set and select either a new data source or an existing data source listed at the bottom of the page. Choose Ticketing for Sports.

In the next step, choose Create Data Set.
In the next step, when QuickSight prompts you to choose your table, you can select the schema and the required table and choose Select. Alternatively, you may choose Edit/Preview data.
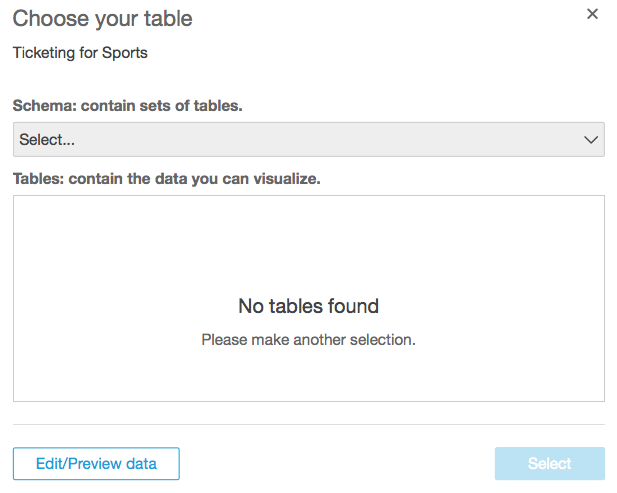
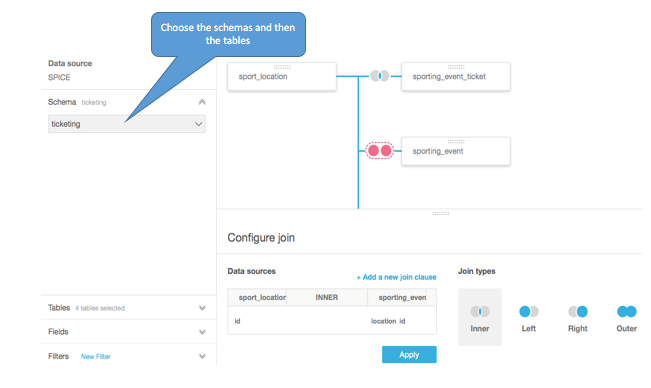
You could use the graphical options shown below to start creating your data set. Given that you have data from multiple sources, it’s safe to assume that your target tables are in separate schemas. Select the schema and tables, select the other schemas, and bring the appropriate tables to the palette by selecting them using the check box to the right. For each join, select the join type and then map the appropriate keys between the tables until the two reds turn to one of the blue join types.
In this case, rather than preparing the data set in the palette, you provide a custom SQL query. On the left pane, choose Tables, Switch to Custom SQL tool.
Paste the following SQL query in the Custom SQL field and enter a name.
select to_char( e.start_date_time, 'YYYY-MM-DD' ) event_date,
to_char( e.start_date_time, 'HH24:MI' ) start_time, e.sold_out,
e.sport_type_name, l.name event_location, l.city event_city,
l.seating_capacity, hteam.name home_team, hl.name home_field,
hl.city home_city, ateam.name away_team, al.name away_field,
al.city away_city, sum( t.ticket_price ) total_ticket_price,
avg( t.ticket_price ) average_ticket_price,
min ( t.ticket_price ) cheapest_ticket,
max( t.ticket_price ) most_expensive_ticket, count(*) num_tickets

from ticketing.sporting_event_ticket t, sourcemysql.sporting_event e,
sourcemysql.sport_location l, sourcemysql.sport_team hteam,
sourcemysql.sport_team ateam, sourcemysql.sport_location hl,
sourcemysql.sport_location al

where t.sporting_event_id = e.id
and t.sport_location_id = l.id
and e.home_team_id = hteam.id
and e.away_team_id = ateam.id
and hteam.home_field_id = hl.id
and ateam.home_field_id = al.id

group by to_char( e.start_date_time, 'YYYY-MM-DD' ),
to_char( e.start_date_time, 'HH24:MI' ), e.start_date_time,
e.sold_out, e.sport_type_name, l.name, l.city, l.seating_capacity,
hteam.name, ateam.name, hl.name, hl.city, al.name, al.city;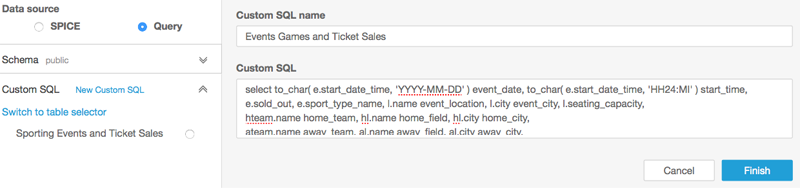
You can choose Save and visualize and view the QuickSight visualization toolkit and filter options. Here you can build your story or dashboards and start sharing them with your team.
Now, you can choose various fields from the field list and the various measures to get the appropriate visualization, like the one shown below. This one was aimed to understand the date at which each event in each city reached the maximum capacity.
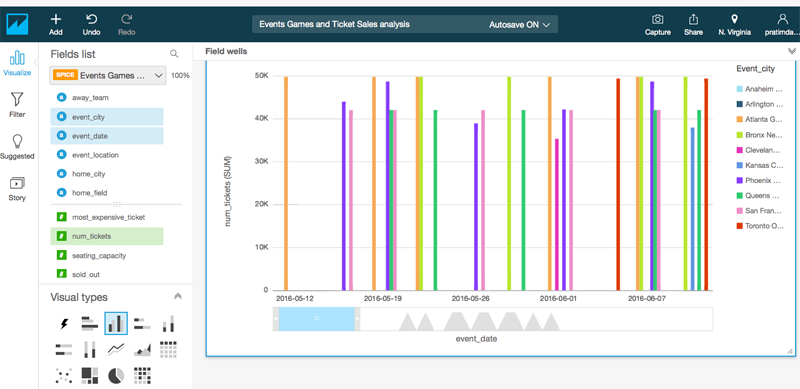
You can also combine many such visualizations and prepare your dashboard for management reporting. The analysis may also drive where you need to invent on campaigns and where things are going better than expected to ensure a healthy sales pipeline.

Summary
In this post, you used AWS DMS to converge multiple heterogonous data sources to an Amazon Redshift cluster. You also used Quicksight to create a data visualization on the converged dataset to provide you with additional insights. Although we have used an e-commerce use case related to an events company, this concept of converging multiple data silos to a target is also applicable to other verticals such as retail, health-care, finance, insurance and banking, gaming, and so on.
If you have questions or suggestions, please comment below.
About the Author
 Pratim Das is a Specialist Solutions Architect for Analytics in EME. He works with customers on big data and analytical projects, helping them build solutions on AWS, using AWS services and (or) other open source or commercial solution from the big data echo system. In his spare time he enjoys cooking and creating exciting new recipes always with that spicy kick.
Related
